2023 Change Log
Dec 21, 2023
What’s new
Overall Features:
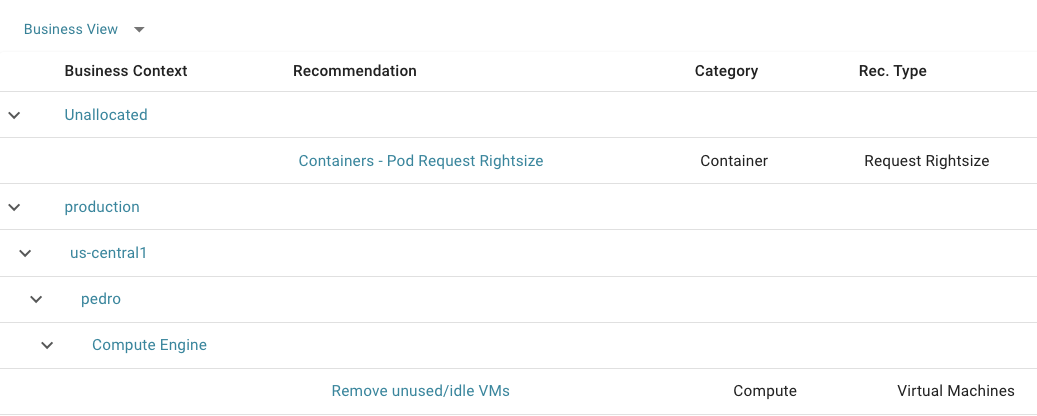
We updated the Recommendations dashboard to allow to easily change to a Business View of the allocation mapped to the lens business tree. This way you can expand a node to see where is allocated to:
Dec 14, 2023
What’s new
GenAI Features:
You can now ask Yota AI Assist any questions about tags (or GCP labels), including questions about released data. For example, "What were the production costs last month?"
You can also ask for a list of values for tags. For example, "List the values for team".
Overall Features:
We automatically show the "Top 15" values when a widget has more than 15. Otherwise, we just show the widget name.
Fixed
When the date range only includes a single data point and no previous data exists, we don't show the percentage variation (previously shown, at times, as thousands of percent difference).
Dec 7, 2023
Fixed
Improved cost category mappings for AI services:
Added additional pre-condition mappings to the cost category for AI services. This means various GCP services related to AI, like Vertex AI Notebooks, Vertex Explainable AI, and others, are now correctly categorized under AI for better cost analysis.
Fixed issue with unexpected percentage differences in cost change charts. We no longer show comparisons unless there are two valid data points from previous and current periods. This prevents misleading percentage changes when data is missing.
Nov 30, 2023
What’s New in GenAI Features:
We updated the preset questions on the Yota AI Assist. It now uses dynamic ranges (like last 3 months) for all questions
We made updates to the agent to allow it to answers more complex questions that require calculation, like “By what percentage have our costs changed each month this year?”
What’s New in Overall Features:
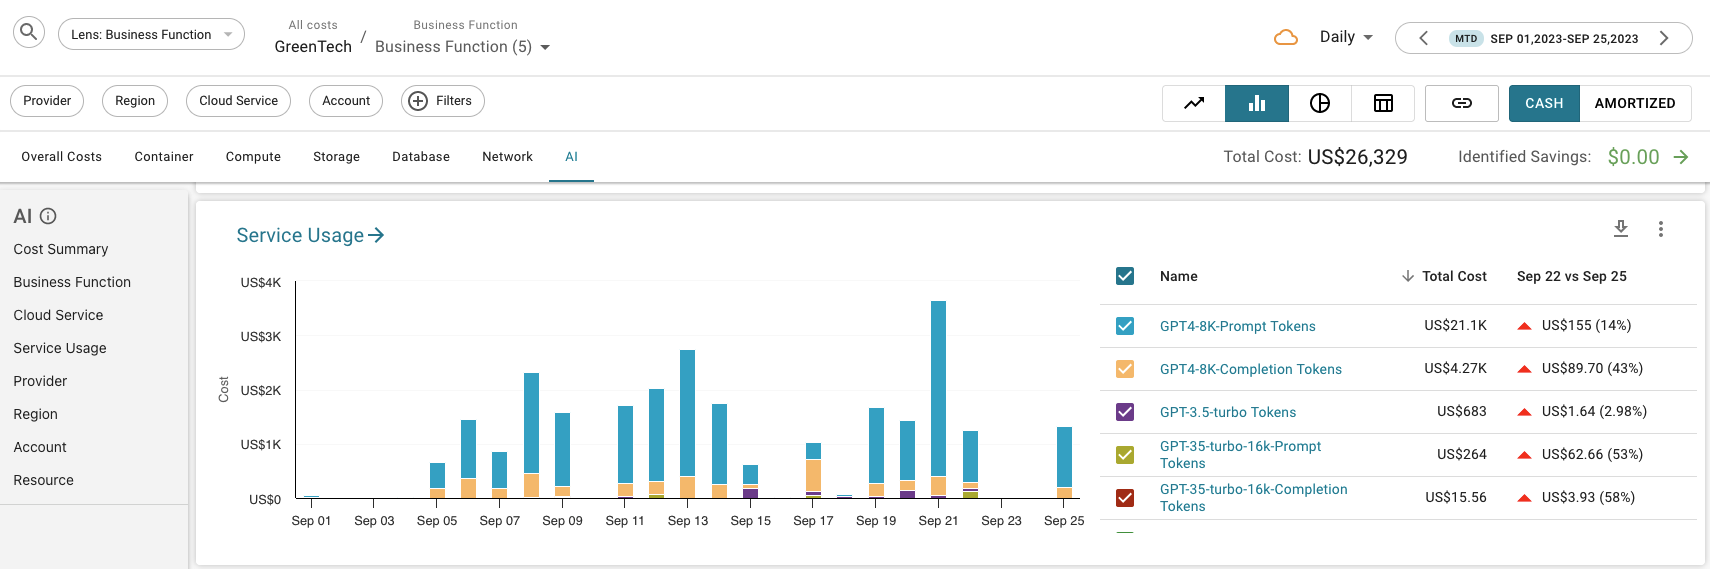
We add a new cost category that aggregate the AI related costs, coming from traditional AI, GenAI, LLMs, or Machine Learning. Here is an example of see the cost of Azure Open AI Cognitive services:
When opening a widget in maximized view, you can now select all the values as an option, instead of just the top 15
What’s Fixed
The filter to exclude values that does not contain “unspecified” was not working. It now works.
Nov 28, 2023
What’s New in Overall Features:
We added support for AWS Fargate clusters. We are now able to give you the cost breakdown of these clusters by cluster name and app label, as well as account and region.
What’s Fixed
We refactor Cost Analytics middle layer to dramatically increase its load time. There is no impact on the front-end, other than the pages loads much faster
Nov 23, 2023
What’s New in GenAI Features:
We updated our Yota AI Assist to use the latest to use the latest capabilities from OpenAI. The agent can now:
Answer much more complex questions, like “what were the cost drivers for the last 6 months”
The agent starts typing the answers as it is processing instead of you having to wait for the full answer to be processed. This makes it more conversational.
There is a toggle to see the “show work” which shows what is being done in the backend.
What’s New in Overall Features:
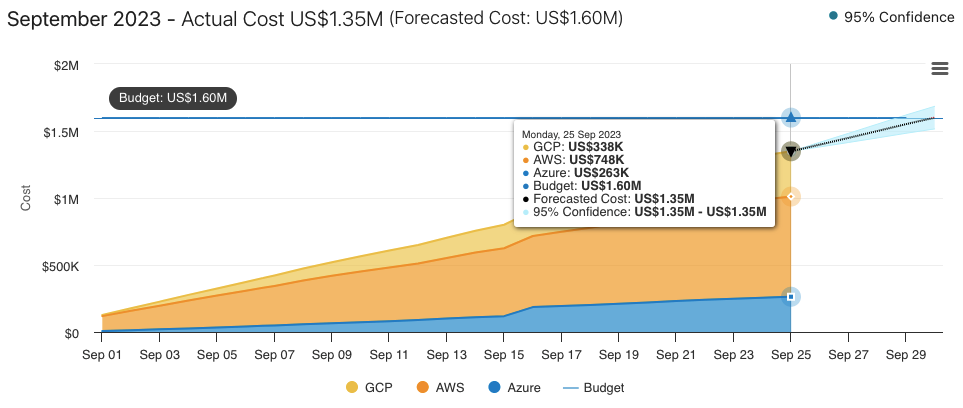
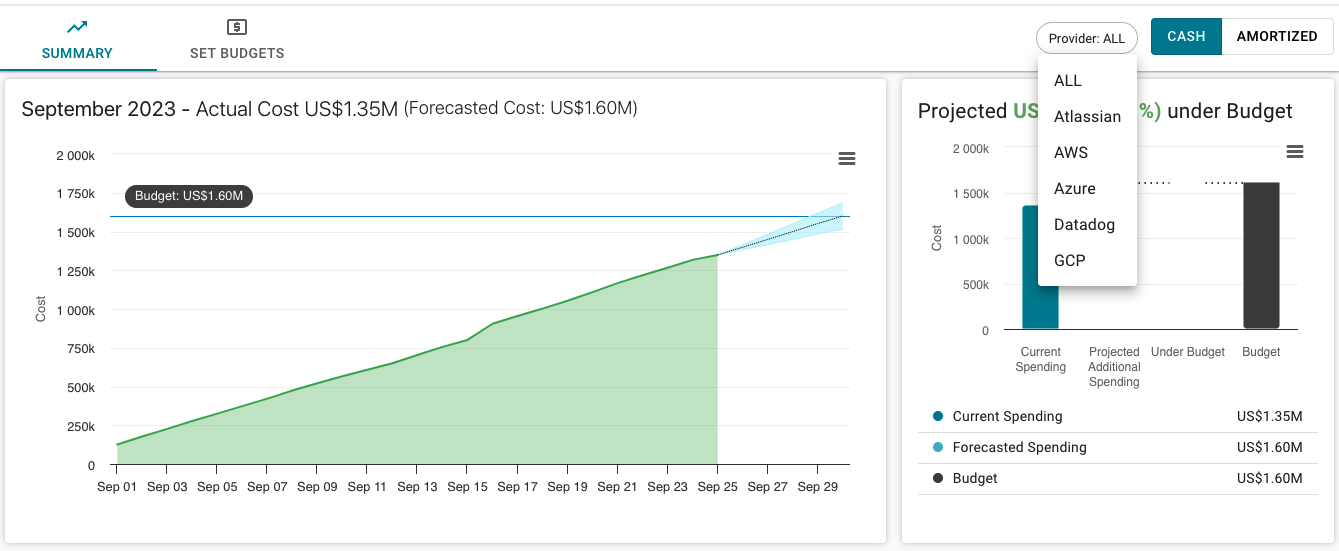
For Budget & Forecast, we now show the overlay of all Cloud and SaaS Providers budget, to make it easy to see that contribution of each provider to the overall. You can also click on a provider name to exclude it from the view:
We add a link to the Allocation documentation page from the allocation dashboard to make it easier to get information on how to create a lens
We added a little summary of the selected data, which will be the number of days, or weeks, or months, of the indication of the last. This example shows L30D which means Last 30 Days

Report now support pie chart type of chart to be consistent with Cost Analytics and support all types of charts
Alerts & Notifications have been renamed “Alerts & Subscriptions”. This is a more clear term as we now support not just alerts about anomalies, but also Subscription to reports, and you can get a report via email of slack by subscribing to updates.
When you have multiple providers, we now check for the last 6 months of data to device if a provider widget and top filter should be displayed or not. This will allow you to see the widget and top filter as long as you have added more than 1 provider in the last 6 months.
What’s Fixed
In some situation, the date picket would not display the last processed day by default when logging in. This was because of a timezone issue, where the system would use the UTC instead of the local timezone. That is now resolved, and the dates will display always in the user’s timezone.
Editing the name of a Tag based widget had an issue before where the interface would not allow to type a new name and save it. This is now resolved.
Nov 16, 2023
What’s New in Overall Features:
For Anomaly details, we now have a link to open that anomaly in cost analytics filters by that anomaly data range and filtered service, together with the ling to the table of affected resource
When editing Azure connection, you can now edit all the fields, including the export files parameters
What’s New in GenAI Features:
The Yota AI Assist now recognizes your login name, and uses it to interact with you.
Additionally, you can click on the “+” to start a new chat, even in the collapsed version of the agent
What’s Fixed
In Cost Analytics, the Compute category Identified Savings now shows the correct value. Before it was miss-linked
The Cost Summary widget now opens fine in maximized view
Nov 9, 2023
What’s New in Overall Features:
Added a new left menu for “Help”. This links to Change Log, Docs, and Status Page
Added Sorting for Budget and Forecast children contextes for all columns
Updated the Cost Analytics decimal precision - we now do not show decimal values for delta percentages over 10%
What’s New in GenAI Features:
When using the Lens Build with AI, we now automatically add nodes for missing tags with the format “No <level-name”. For example, of the “Team” tag is missing, we’ll add the “No Team” node. This allows us get higher allocation percentage as sometimes in a multi level lens, like Team > Service > App, there can be resources that have missing tags, at any of the levels. With this new functionally, you can better find the missing tags, but still see the allocation rolling up to the top even when there is a missing tag for App, in the example above.
For for Yota AI Assist, we now show the username with first name + last name initial, to show a more conversational chat message:
Tip: as a Global Admin, you can enable the Yota AI Assist from Settings
What’s Fixed
When navigating to Anomaly details, we now automatically navigate the lens context to the node. Before it would display the parent costs
We updated the preset questions with dynamic ranges, and example of more complex questions
Nov 2, 2023
What’s New in Overall Features:
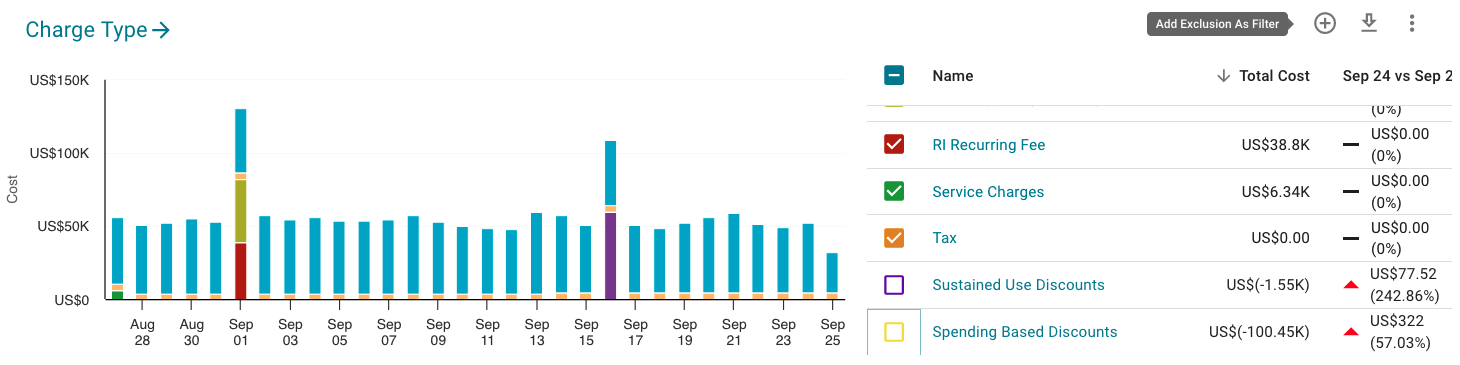
The Charge Type widget allows drilling down. This allows for filtering by “usage” for example, but also for excluding certain charges, like discounts and credits. In this example, we’re adding a filter to exclude discounts
What’s New in GenAI Features:
We have the lens builder (business hierarchy) using GenAI now in beta. With this capability, creating a new lens can just a few minutes, or few seconds based on its complexity. For complex business hierarchies with dozens of level 1 nodes, combined with dozens of level 2, and level 3, it could take many days to build manually. Now it takes a few second or minutes to build. This is a very powerful tool. Here is a sample of what it can do.
Oct 31, 2023
What’s Fixed
When drilling-down to a Service Usage item, the added filter value would not reflect on the overall costs, nor would be removable without resetting all filters. With this fix, this filter is now working properly
Oct 26, 2023
What’s New in Overall Features:
In Budget & Forecast, we now support filtering by Provider. This means that you can set global budgets and check forecasts, or do it on a per provider basic. This capability makes is much more flexible in terms of setting in individual budget target per provider and tracking its respective forecast.
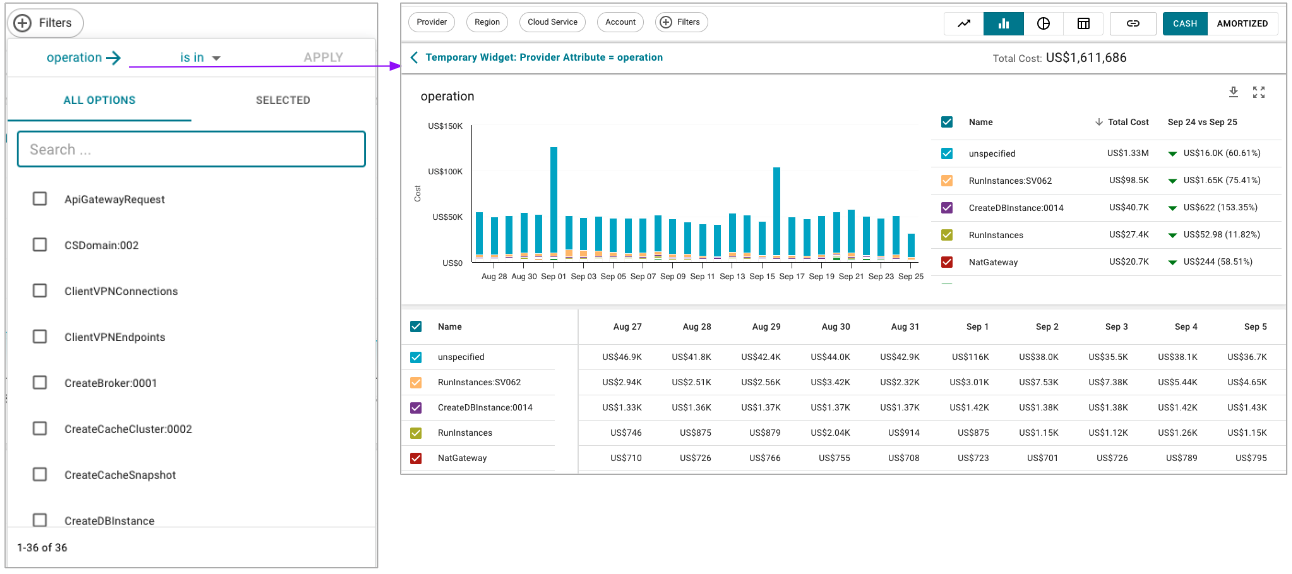
Added support for a “temporary” widget. Sometimes you want to see what the data looks like for a Tag or Provider Attribute quickly, instead of having to create a new widget. For example, I want to see what the provider attribute named “operation” values and costs are. Then you select, and click at the name “operation ->” to open the temporary widget:
What’s New in GenAI Features:
We introduced a set of preset questions. That makes it easier to click and see results with very common questions
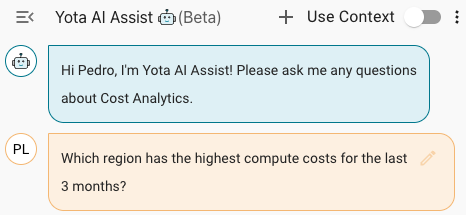
Group by is now support. An example is: “What was our cost per AWS Service for the last 3 months in us-east-1?” This will aggregate costs by a specific region.
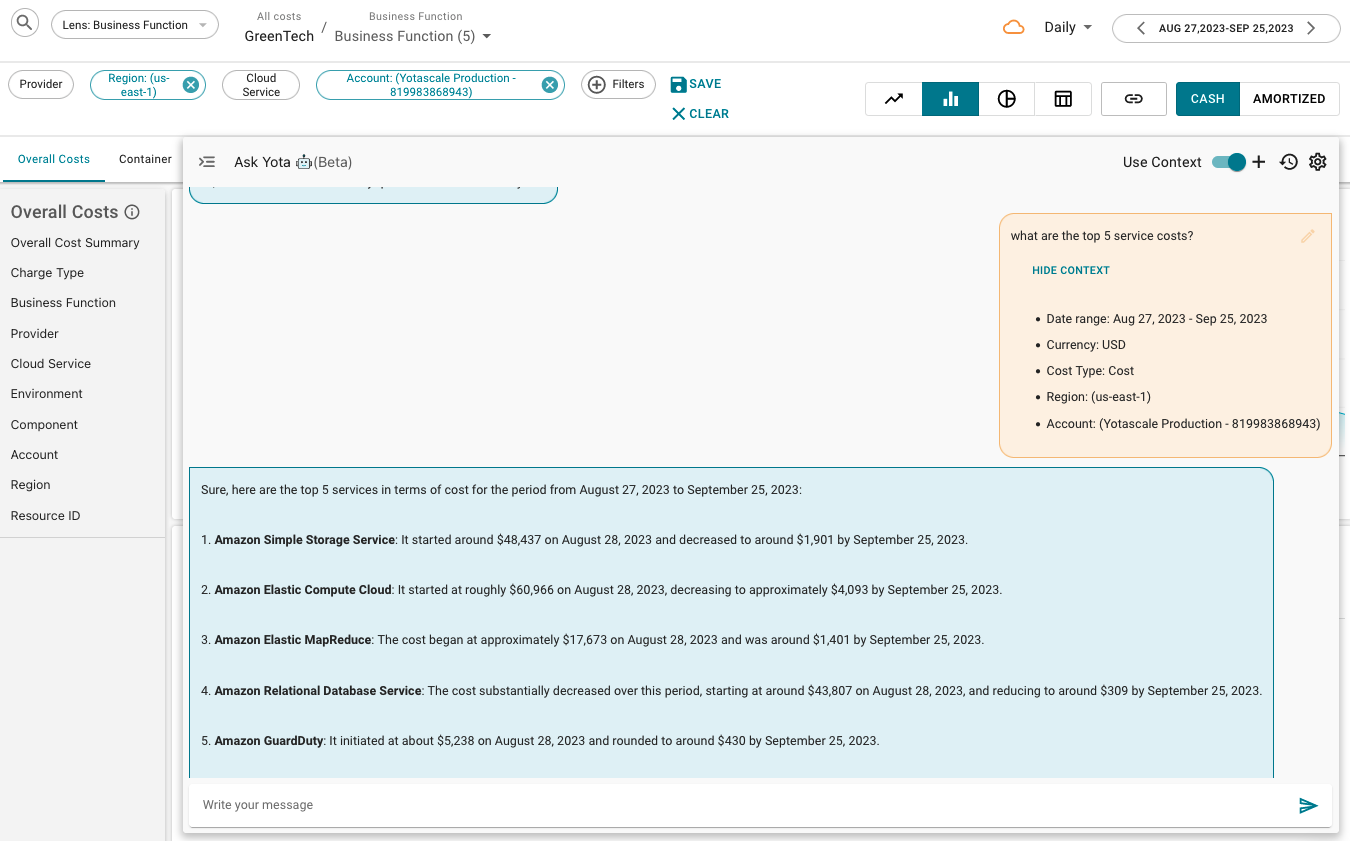
You can now “Use Context”, meaning the selected filter, cost type, data range and currency will be automatically included in your prompt. This means you don’t have to type all the filters to get an answer. Here is an example where the Region, Account Number, Date Range, and Cost Type are read from the Context:
What’s Fixed:
For GCP Onboarding, we now display the field for the BigQuery Recommendations Export Name to make it easier to connect to the GCP recommendations
Oct 17, 2023
What’s New
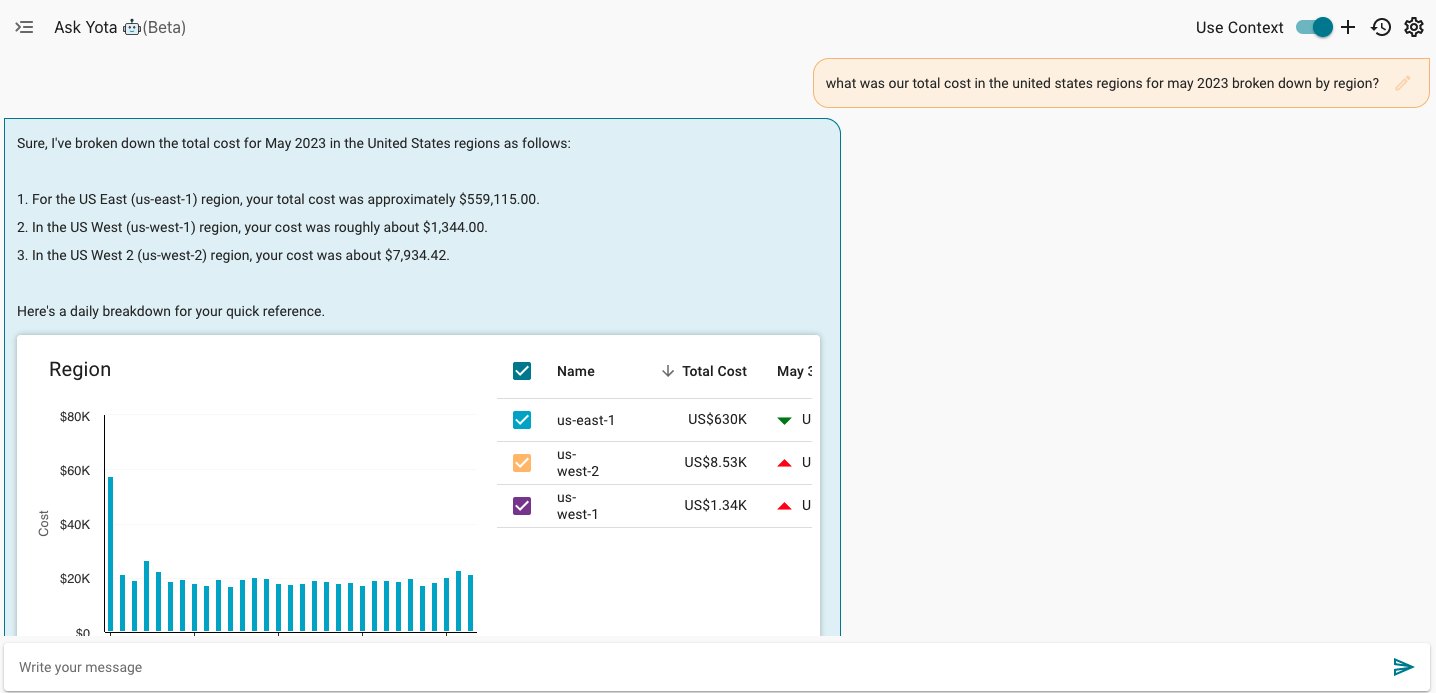
We released the first beta version of our Yota Assist (GenAI / LLM) agent. This feature needs to be enabled from the Global Settings - Yota Assist page. If you want to try it, please contact us.This agent is able to answer questions like:
What were the top 5 service costs for last 7 days?
What was the total cost of EC2 in Sep 2023 in production?
what was our total cost in the united states regions for may 2023?
A few screenshots:
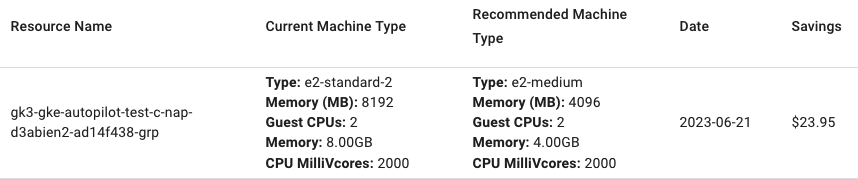
For CGP recommendations, we now provide detailed information about the resource IDs. For rightsizing the compute engine, we provide detailed information about the existing resources and the recommended resource.
What’s Fixed
For the Reports dashboard, when saving a report with dynamic dates, like “Last 30 Days”, the report is updated on a daily basis with the last processed data. Previously, the report could have shown older (and static) dates.
Oct 12, 2023
What’s New
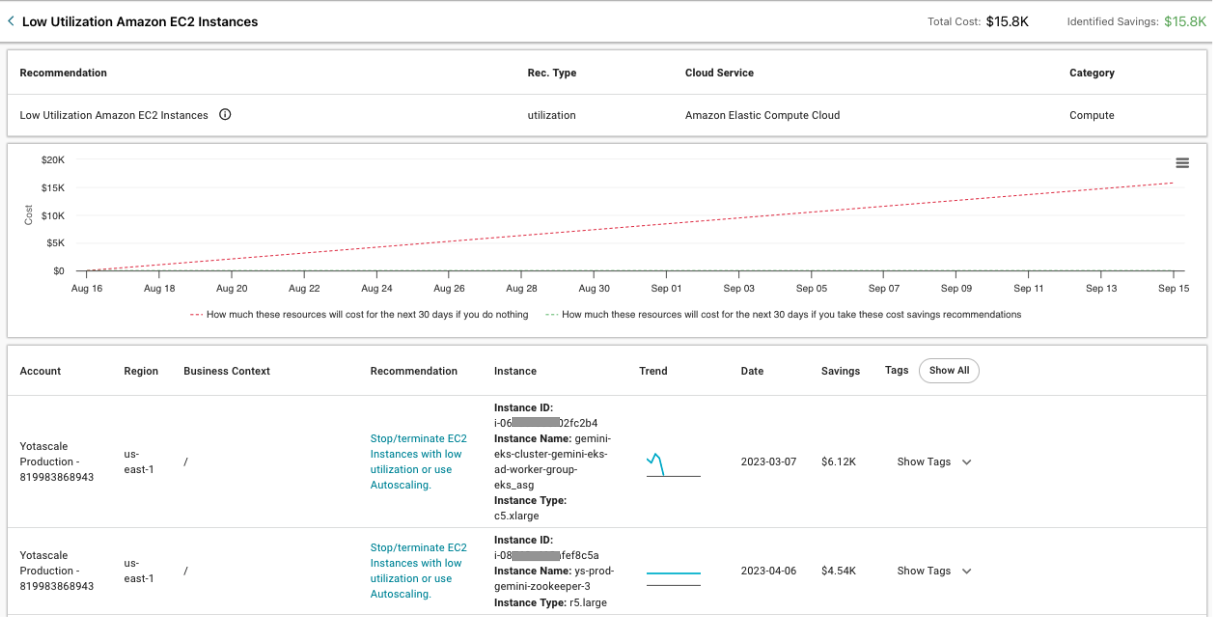
We linked the identified savings (recommendations) to cost analytics. Now you can see what the identified savings are for each business context. Keep in mind that only allocated costs will have possible savings, as we match the resource ID of of the costs for a business context to its respective utilization recommendations via resource ID
Added ability to populate all values for the lens editor for service charges, purchases, and commitments It is much easier to build an advanced allocation lens.
The Business Function widget now shows all nodes. This makes it easier when there are dozens of nodes in a level and you want to see the cost for each of them (instead of just the top 15).
What’s Fixed
In the Alerts/Subscriptions, when the user had multiple roles, sometimes not all subscriptions would be visible for the Global Admin. Now the Global Admin always sees all subscriptions.
Sep 29, 2023
What’s New
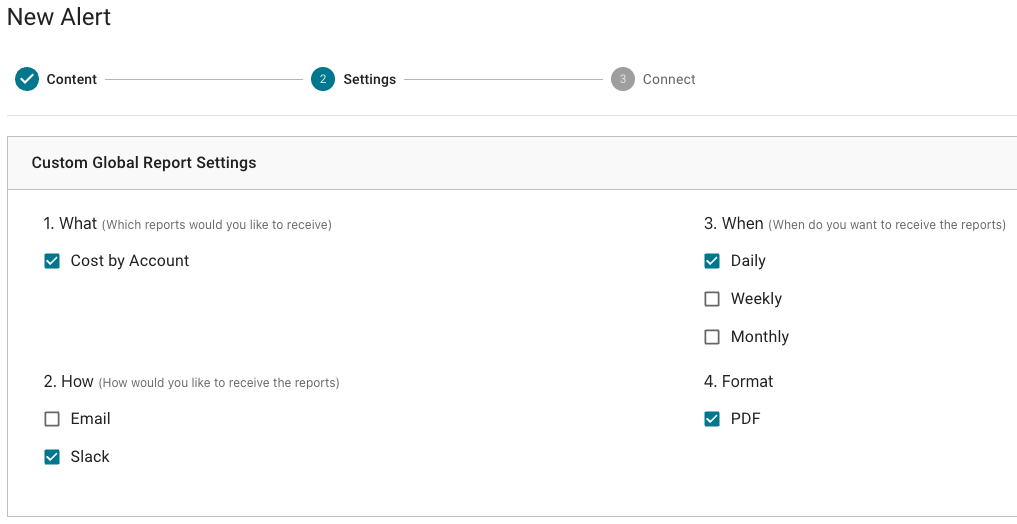
Added support to send Alerts and Notifications via Slack. This makes this component much more flexible, as we understand that many of our users have a preference for Slack over email.
Added support for subscribing to a report. The delivery of a Report is flexible and may be daily, weekly, or monthly. Reports may be sent via email or the Slack channel.
We greatly extended the lens creation and editing functionality.
You can now duplicate a lens (business hierarchy):
You can now “duplicate” a lens. This action makes it easy to make modifications while keeping the original in production, meaning it is visible to everyone and in a “Published” state. You may choose to keep the duplicate hidden from Cost Analytics when “Unpublished” while working on it.
For our customers that use our Yotascale Classic Dashboard, we added an option to convert the business hierarchy into the new lens allocation policies in the Yotascale Next Dashboard. This will allow us to add many more rules, including Shared Cost Allocation rules to split the cost of any item.
We added support for “Account Number” in the cloud service and container service business rules. Sometimes it is easier to just enter the account number than the full ID. This is especially useful for AWS accounts.
We made a few updates to the Date Picker and Last Process Date
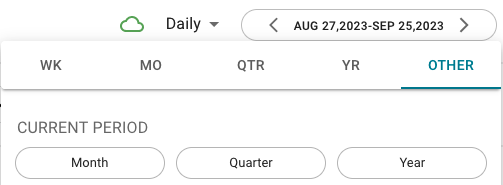
Add support for additional Data Picket preset dates for the “CURRENT PERIOD”. You can now get the current month, quarter and year with a preset button
We added a shortcut to show the selected aggregation of data. This makes it faster to change, or if you take a screenshot, the aggregation selection is carried over
We made the Last Processed Date more visually intuitive. We created an icon for the Last Processed date, where it will be green if the data processing is current or orange if there is a delay.
For the Container Cost Line Item, we now show addition fields per line item: Cluster Type, Cluster Name, Namespace, and Workload Type.
When creating a new AWS connection, we added the ability to automatically grab the CUR file bucket name, prefix, and report name. We then display them via a drop-down, which helps you select the correct values and avoids copy-and-paste typos.
What’s Fixed
We have a feature that automatically shows or hides the provider filter and widget if there is only one single provider. Now that we have added Total Platform Cost, we can add any of your platform costs, which means that you may just have one Tier 1 (IaaS) provider but other SaaS providers. You will now always be able to see the filters and widgets when there are multiple providers, regardless of whether it is an IaaS, SaaS, or any other.
In some situations, when adding or updating an AWS connection, the last screen to save the connection would go blank. That will not happen anymore.
Sep 21, 2023
What’s New
We added a direct link to our documentation page in Settings > Onboarding. See the top-right icon. We will be adding more direct links to other pages as well soon
Add further normalization to Utilization Recommendations to display a title above and have a similar experience that will include the account, region, business context, resource information, etc.:
Sep 14, 2023
What’s New
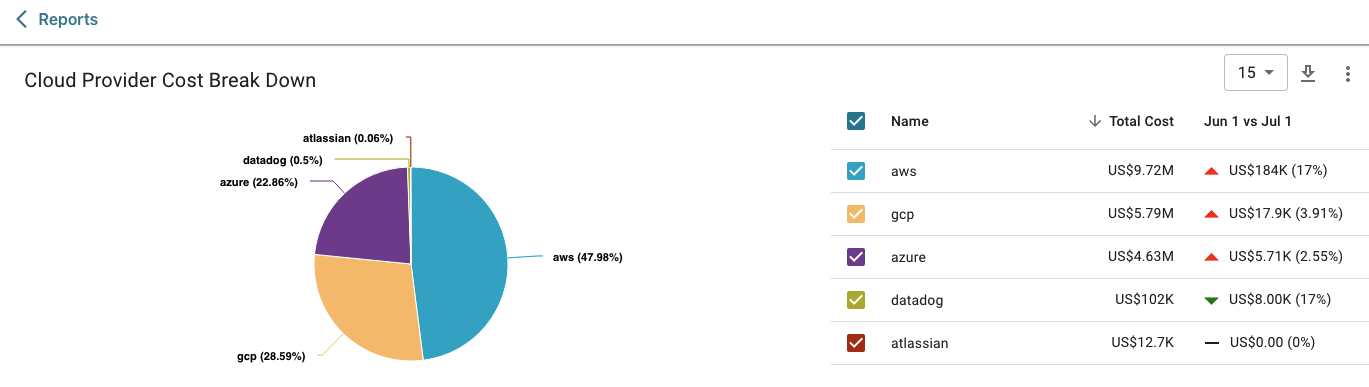
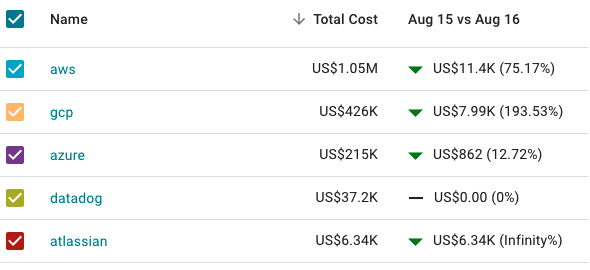
Beyond AWS, Azure, and GCP, any other SaaS provider is now supported. If you can provide the export of the cost and usage report files for other SaaS providers, we can load those costs into the Yotascale dashboard, and you’ll be able to see and allocate those costs. Here is an example of cost visibility for Datadog and Atlassian, on top of the 3 infrastructure providers:
In the Top Filter for Cloud Service, you can now use some of the most common abbreviations to easily find a service, like EC2, S3, RDS, VM, etc.
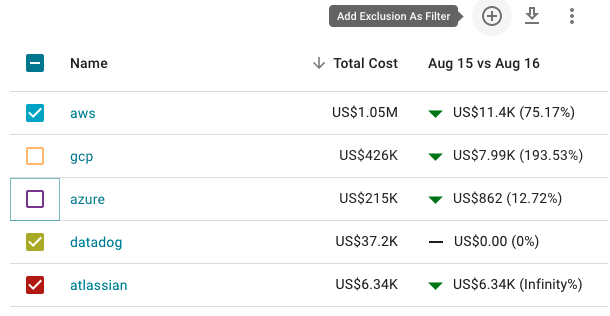
You can now easily exclude values from a widget by clicking on an icon that adds “not in” to the top filter for the unselected values:
You can now clone a Lens
When you copy and paste the URL from a Report, it will not display a message that the report may have changed; it will display the report as copied
What’s Fixed
The Top Filter for Container related costs, under “More Filters” was fixed. There was an issue previously that caused the Container filters not to load.
Aug 31, 2023
What’s New
Added ability to maximize a widget to get a more focused view of the cost of one dimension
Add the ability to see a widget in full-screen mode (hiding all menus) to make it easier to share on a virtual call or during a presentation
Organized the download icons for widgets into a single place
Add a direct link from a widget to its settings to make it easy to add, modify its name or position, or delete it
Add the ability to run forecasts on all nodes for new lenses instead of doing one by one
When there is only one provider onboarded, we don’t display the top filter for provider, and respective widget because it is irrelevant
What’s Fixed
We greatly improved the performance of the Cost Line Item export. It used to take a significant amount of time to process a large number of records
Aug 18, 2023
What’s New
Added further support to drill-down to costs by resource ID:
In Cost Analytics, in the Overall, Compute, Database, and Network tabs, you can now see a Resource ID widget. For storage, we had it already for Buckets
From the “+ Filters” you can also search for a resource ID in the Cloud Service > Resource ID menu option
From the Cost Line Item view, when you search for a resource ID, it adds it as a top filter, so that it filters by that even when you move to other tabs or chart types in Cost Analytics
In the Cost Analytics top filters drop-down list, you can now see the total number of values that exist for that category for the time range. Some category lists may have more than 100 values; therefore, we use pagination to allow you to navigate back and forth. Please note that some filters, like Resource ID, may have millions of values and can take a few seconds to load
In the Cost Analytics top filters drop-down list, we added support for multiple types of logical operands. We now support: is in, is not in, contains, does not contain, starts with, ends with, does not start with, does not end with. There is a “smart” logic to allow a selection of the operand via intention. If your original intention was to use “contains” but then you select specific values, then the new intention is to do a “is in” and the operand will change automatically for that
In Cost Analytics, we improved the responsiveness of the widgets for low resolution by increasing the height of rows to fit all the text for long names
There is a new widget in the Compute cost category to show the cost by Pricing Option
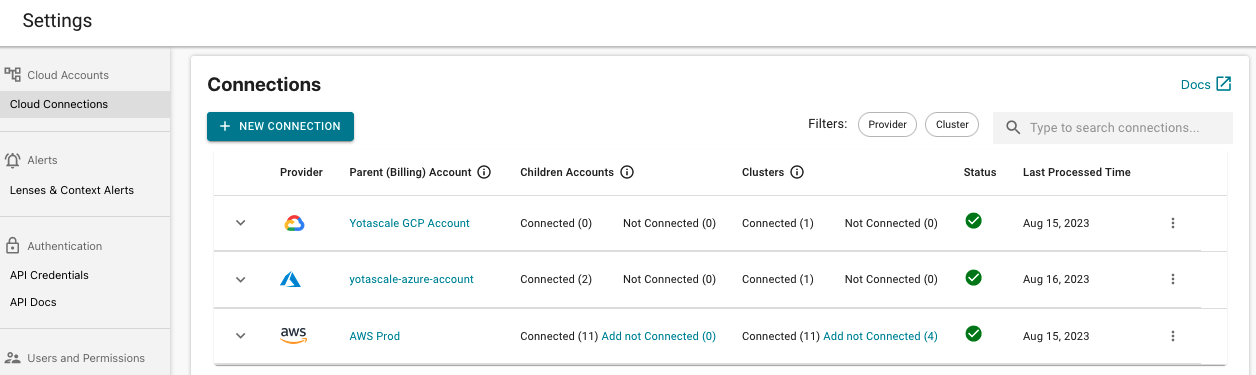
In Settings > Manage Cloud Connections, we now show the number of connected and unconnected clusters as well
If there is only one cloud Provider (AWS, Azure, or GCP) onboarded, then the Top Filter and widget called provider will be automatically hidden as it is not necessary.
Aug 10, 2023
What’s New
Added resource information and other information to additional Utilization Recommendations
Add Tags to Utilization Recommendations
Aug 3, 3023
What’s New
Added support for multi-currency to Reports
Added a new Container widget to display the Capacity Utilization of the cluster broken down by Host-Wastage, Reserved-Utilized, and Reserved-not-Utilized
Added new Filters to the Container cost category: Cluster Name, Cluster Type, Namespace, and Workload Type
Provided the ability view and edit user Roles in the same screen
In the Lens Editor, added direct links to navigate from a context to a shared-cost-allocation for providing easier access to editing shared rules
Jul 21, 3023
What’s New
Created a public status page for our dashboard: http://status.yotascale.io/