Budget & Forecast Dashboard
Overview
Yotascale Budgeting & Forecasting features provide a simple solution for cloud budget owners to plan and manage their costs. Being able to budget and forecast your costs are critical to providing predictability in your spend. Cloud budget owners should use the Budget & Forecast and manage their costs within a Context.
After you have created a set of Contexts that align with how you want to manage your spend (cost centers, stacks, product groups, etc.), the Budgeting feature will allow you to create, view and update budgets with this perspective. Budgets can be tracked at the monthly, quarterly, or annual time-frame. Yotascale will provide forecasts to help you create your upcoming budgets based on the historical trends that we are seeing. Forecasting can also help you manage your spend by alerting you about the possibility that will miss your budget for the time frame. Yotascale will send an alert when as soon as we forecast a budget overrun and again when your spending forecast has exceeded the budget. You’ll also see it prominently displayed in the UI.
Viewing Your Budgets and Forecasts
Budget & Forecast View
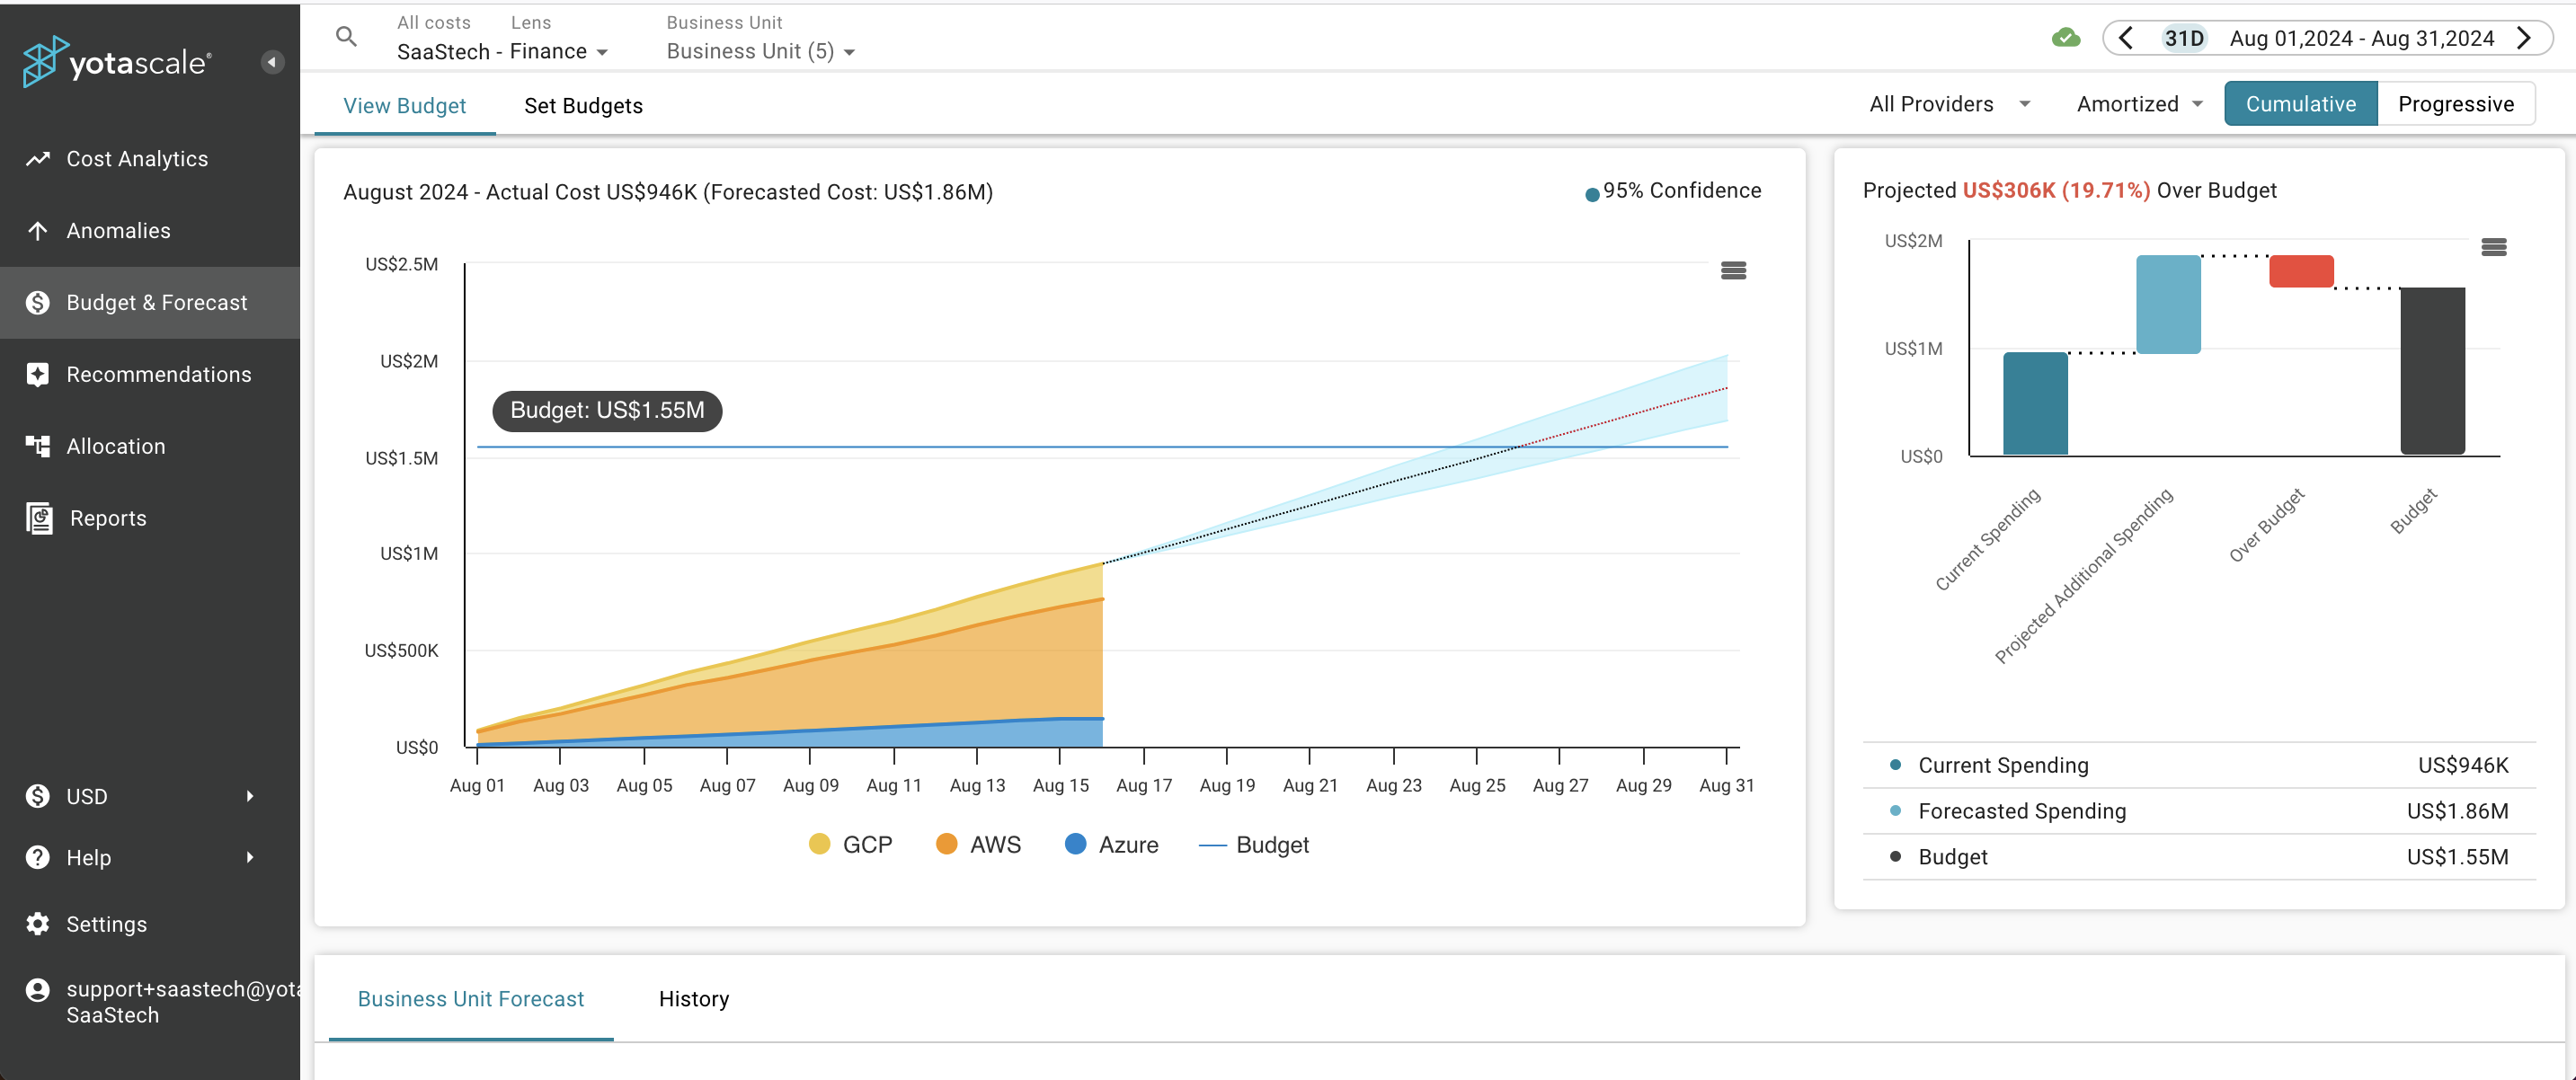
Navigate to the Budget & Forecast View by Clicking on ‘Budget & Forecast’ on the left hand Navigation Menu. Within this view you can see a graph of your actual costs vs. the Budget that has been set. You can switch your View between Cumulative and Progressive costs by clicking the buttons for each view located above the graph to the right. In the cumulative view the costs are shown as a summation of costs from the first day of the time period, so each day will show how much has been spent from the beginning of the period to that date. In the progressive view, each day shows costs associated with that day only. Drop down menus will also let you choose to view your budget for specific Providers and in Cash outflow or with an Amortized View that spreads costs which cover more than one time period over that period equally. (For instance, a yearly license fee of $120 in Cash view would place the entire $120 on the date the fee was paid whereas in amortized view, it would be shown as spending $10 per month on the license.) Each graph also has a download menu - the three horizontal bars at the top right of the graph - that allows you to download the graph as a pdf, an image (in png or SVG vector format), or as a csv file.
Below that chart is a breakdown by the Child Contexts within the current Context. Click on any of those Child Contexts to switch to the dashboard for that specific group. Child Contexts are subdivisions of the current Context that have been defined by the Lens during the creation process. If there are no further subdivisions in the hierarchy there will not be any Child Contexts displayed. There is also a History Tab that will let you quickly view how actual costs have compared to the budget for previous months. On the right of each child context is a “View Analytics” link that will bring up the Cost Analytics dashboard for that Child Context so you can get a closer look at the spending associated with that Child Context.
Changing the Viewed Lens
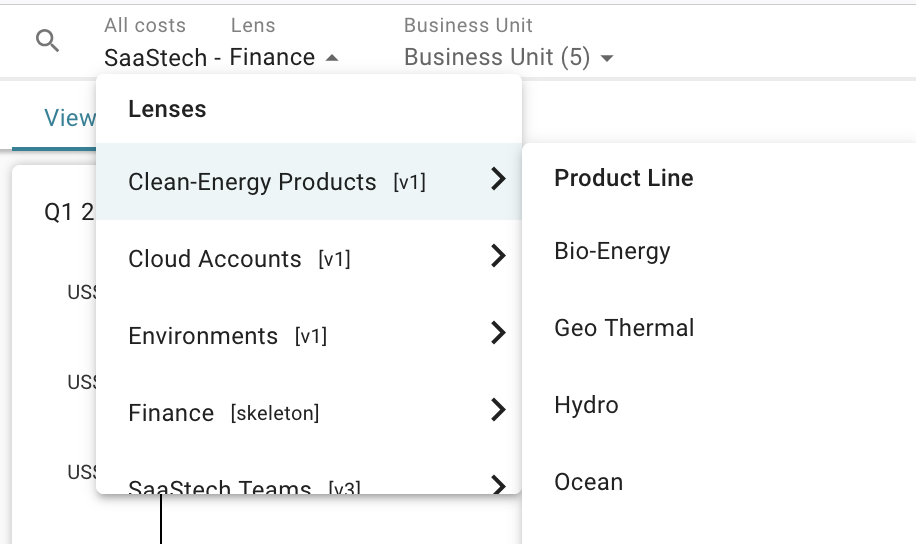
The budget shown depends on the lens that you have set as current. In this case, we are looking at budgets for the Business Units being tracked by Finance. If you have access to multiple Lenses, you can change the Lens by using the drop down menu at the top left of the screen. Scroll over a Lens name to see the sub-menu of Contexts tracked by that Lens. You can choose another Context or click on the Lens name to see all of them in a combined view. If you know the name of the Lens you want to choose, you can also click on the magnifying glass to search for it by name. If you are in one of the sub-menu Lenses and wish to back out to a higher level, you can also click on the branch name above the subdivisions to get back to that level.
Changing the Viewed Date Range
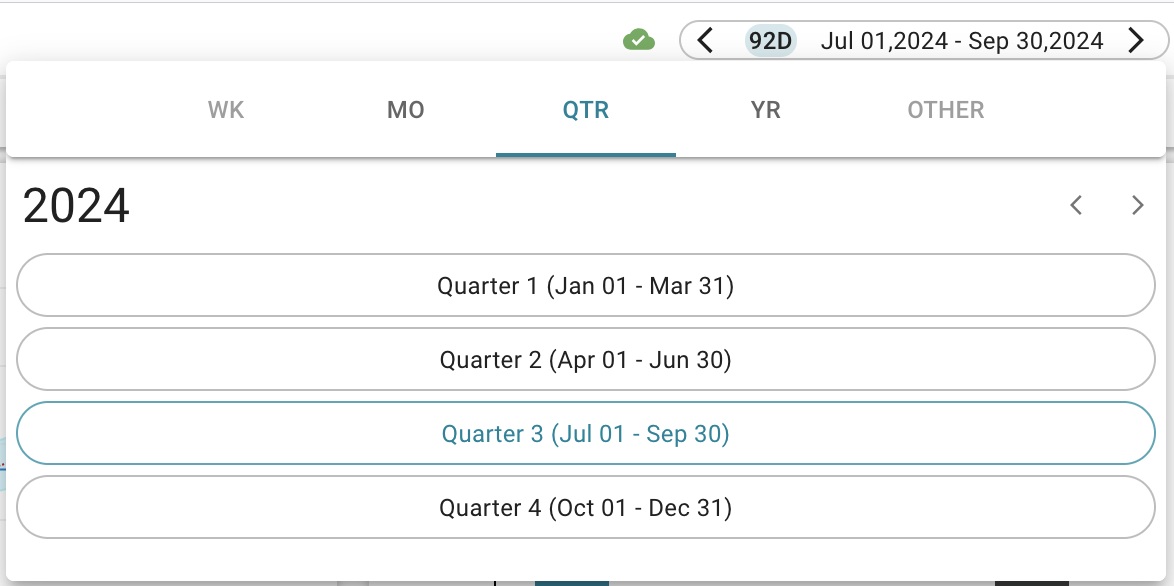
Likewise, we can change the time range for the budget we are viewing by using the Date menu on the upper right of the screen. Clicking on the arrows on either side of the displayed date will move you backward and forward in time by the same increment of time that you are already viewing. If you click on the date range itself, a pop up menu allows you to choose a specific date range to view. In the Budget & Forecast module you are only able to select monthly, quarterly, or annual granularity.
Setting Budgets
Budgets can be set in the Budgets & Forecast View by clicking on “Set Budgets”. Budgets are set on a monthly basis. Enter budget values for the months you wish to set and click on “Save Changes”. You can switch between Calendar Year and Fiscal Year to change which months are assigned to the different quarters.
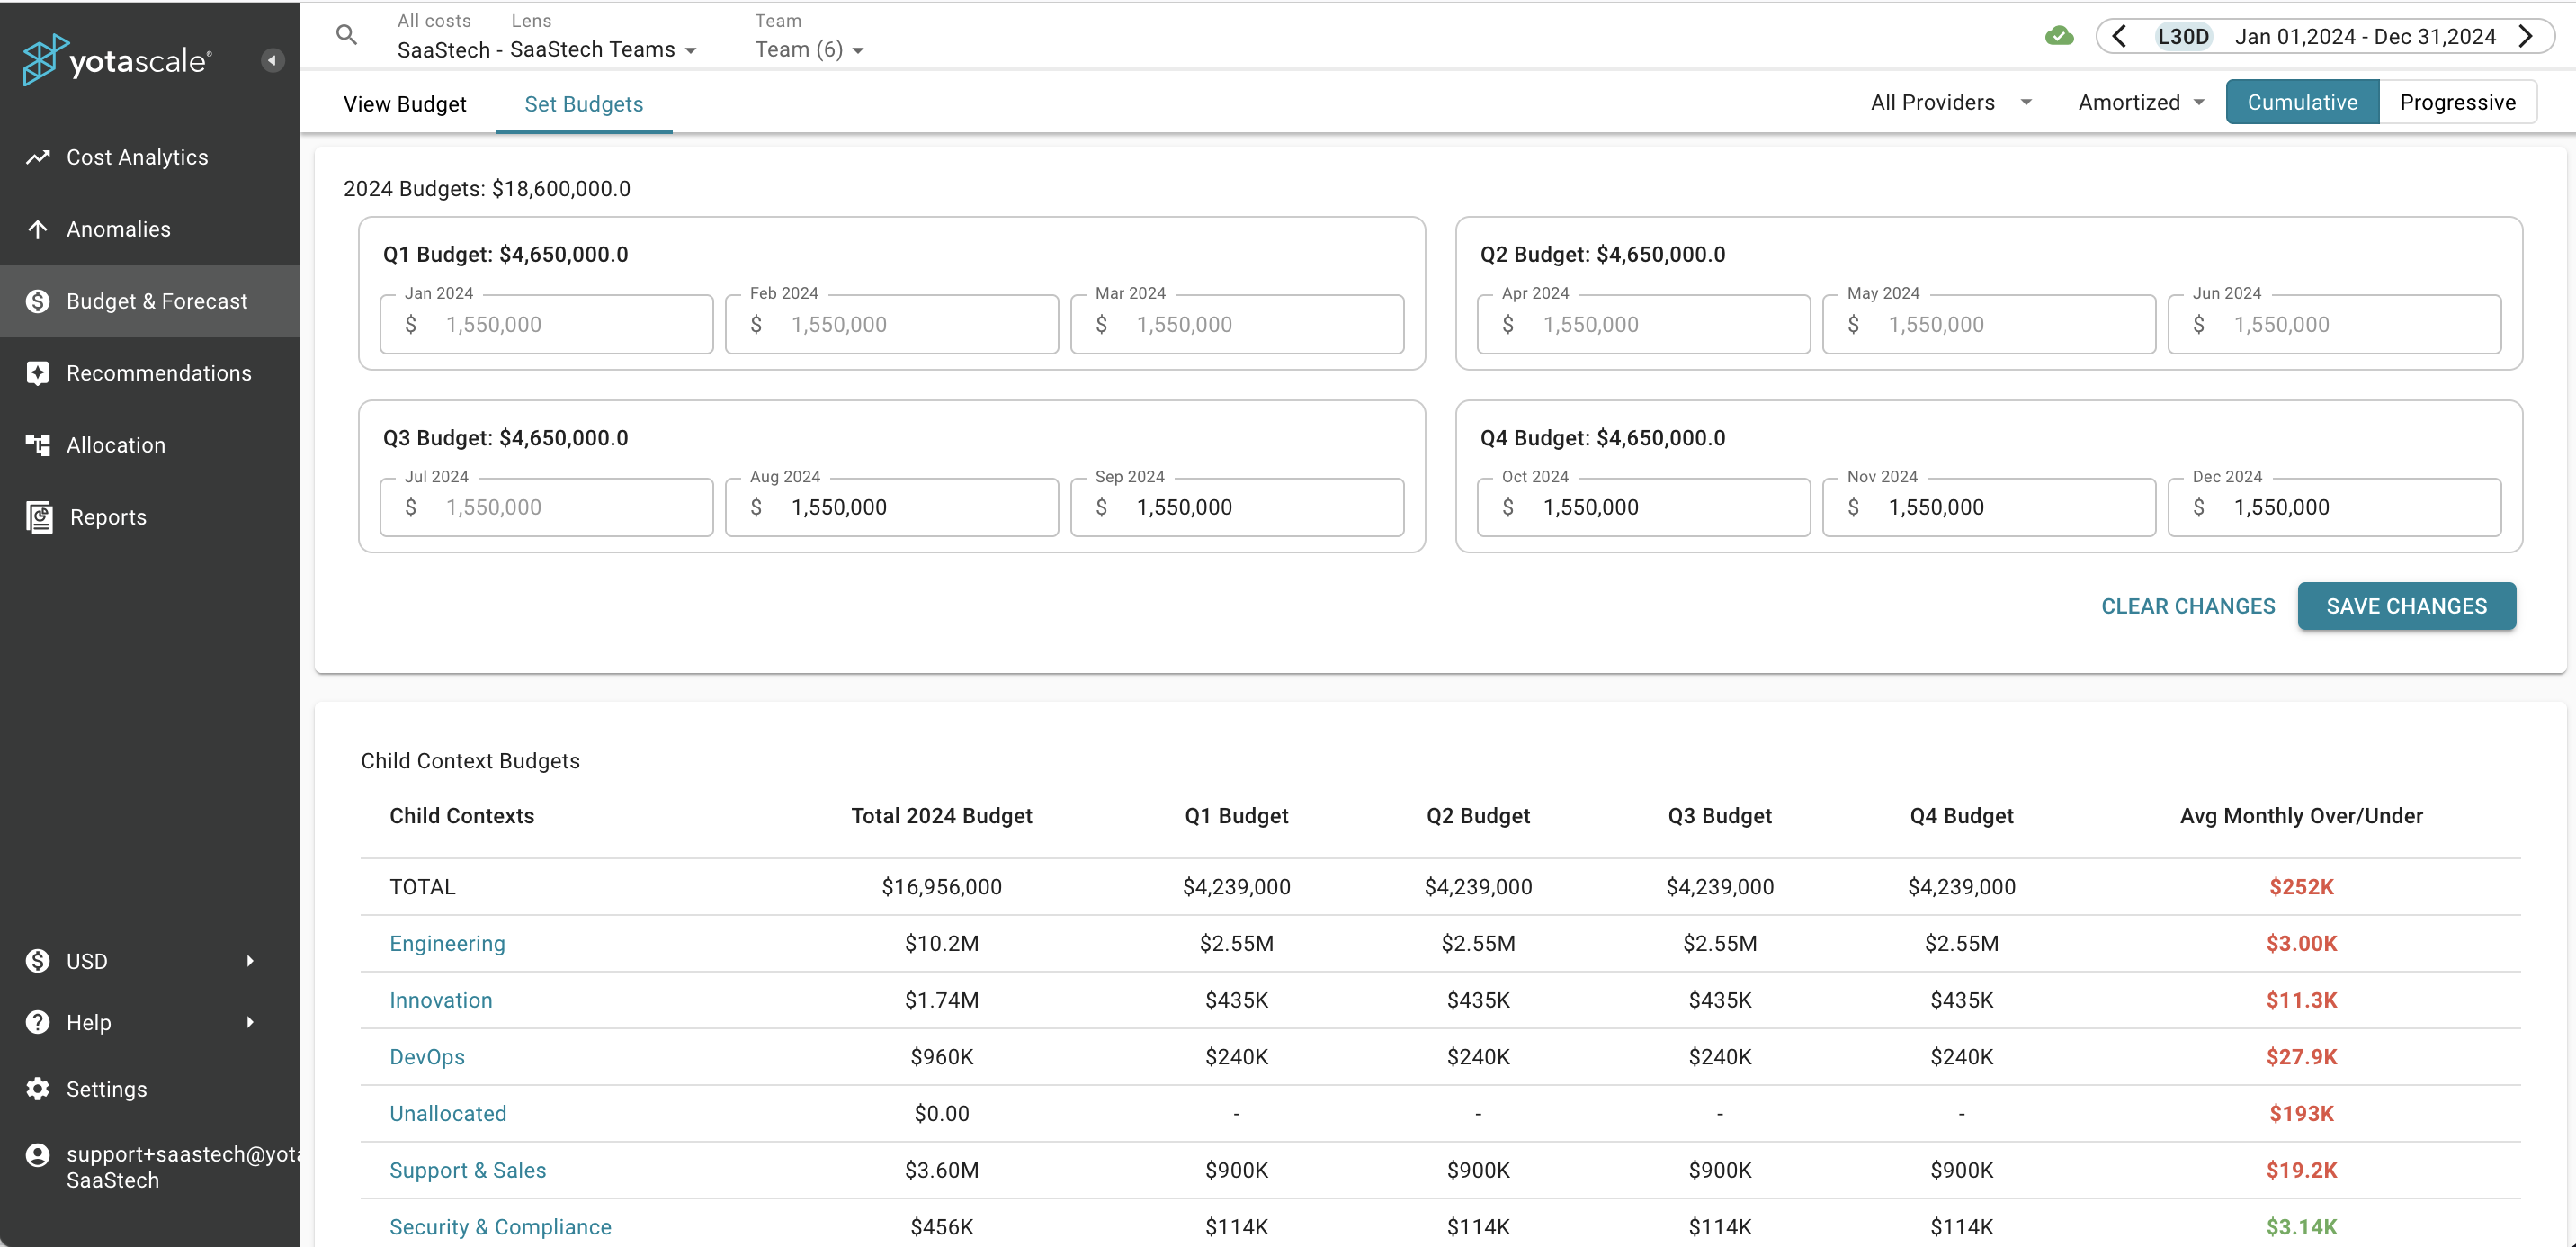
You can set a budget at any context level but those budgets apply only to that context level. The app will not automatically split a budget set at one context level across it’s child contexts. Nor will it add up the child context budgets to assign a budget to a parent level. This is to allow users the flexibility to divide their budgets among child contexts in the way that makes the most sense for their company.
When setting a budget for a parent context you should include the budget for all child contexts in addition to any unallocated funds. You will get a popup warning if you try to set a budget that gives a parent context a smaller budget than the sum of it’s child contexts' budgets. You will also get a popup warning if you try to set a child context’s budget higher than the parent context’s budget. You can choose to confirm that you wish to set the budget as entered if desired.
You can unset the budget for a context by removing the value for the corresponding month and clicking on Save Changes.
A zero budget is not the same as an unset budget. If you do not set any budget at all, you will still see forecast data for any top level Context and any child context which you have explicitly set to run forecast; but you will not get any alerts to indicate that spending is exceeding the budget as there is no budget. A zero budget is treated as a budget of $0 and any spending will be treated as having exceeded the budget.
Uploading a Budget from a CSV file
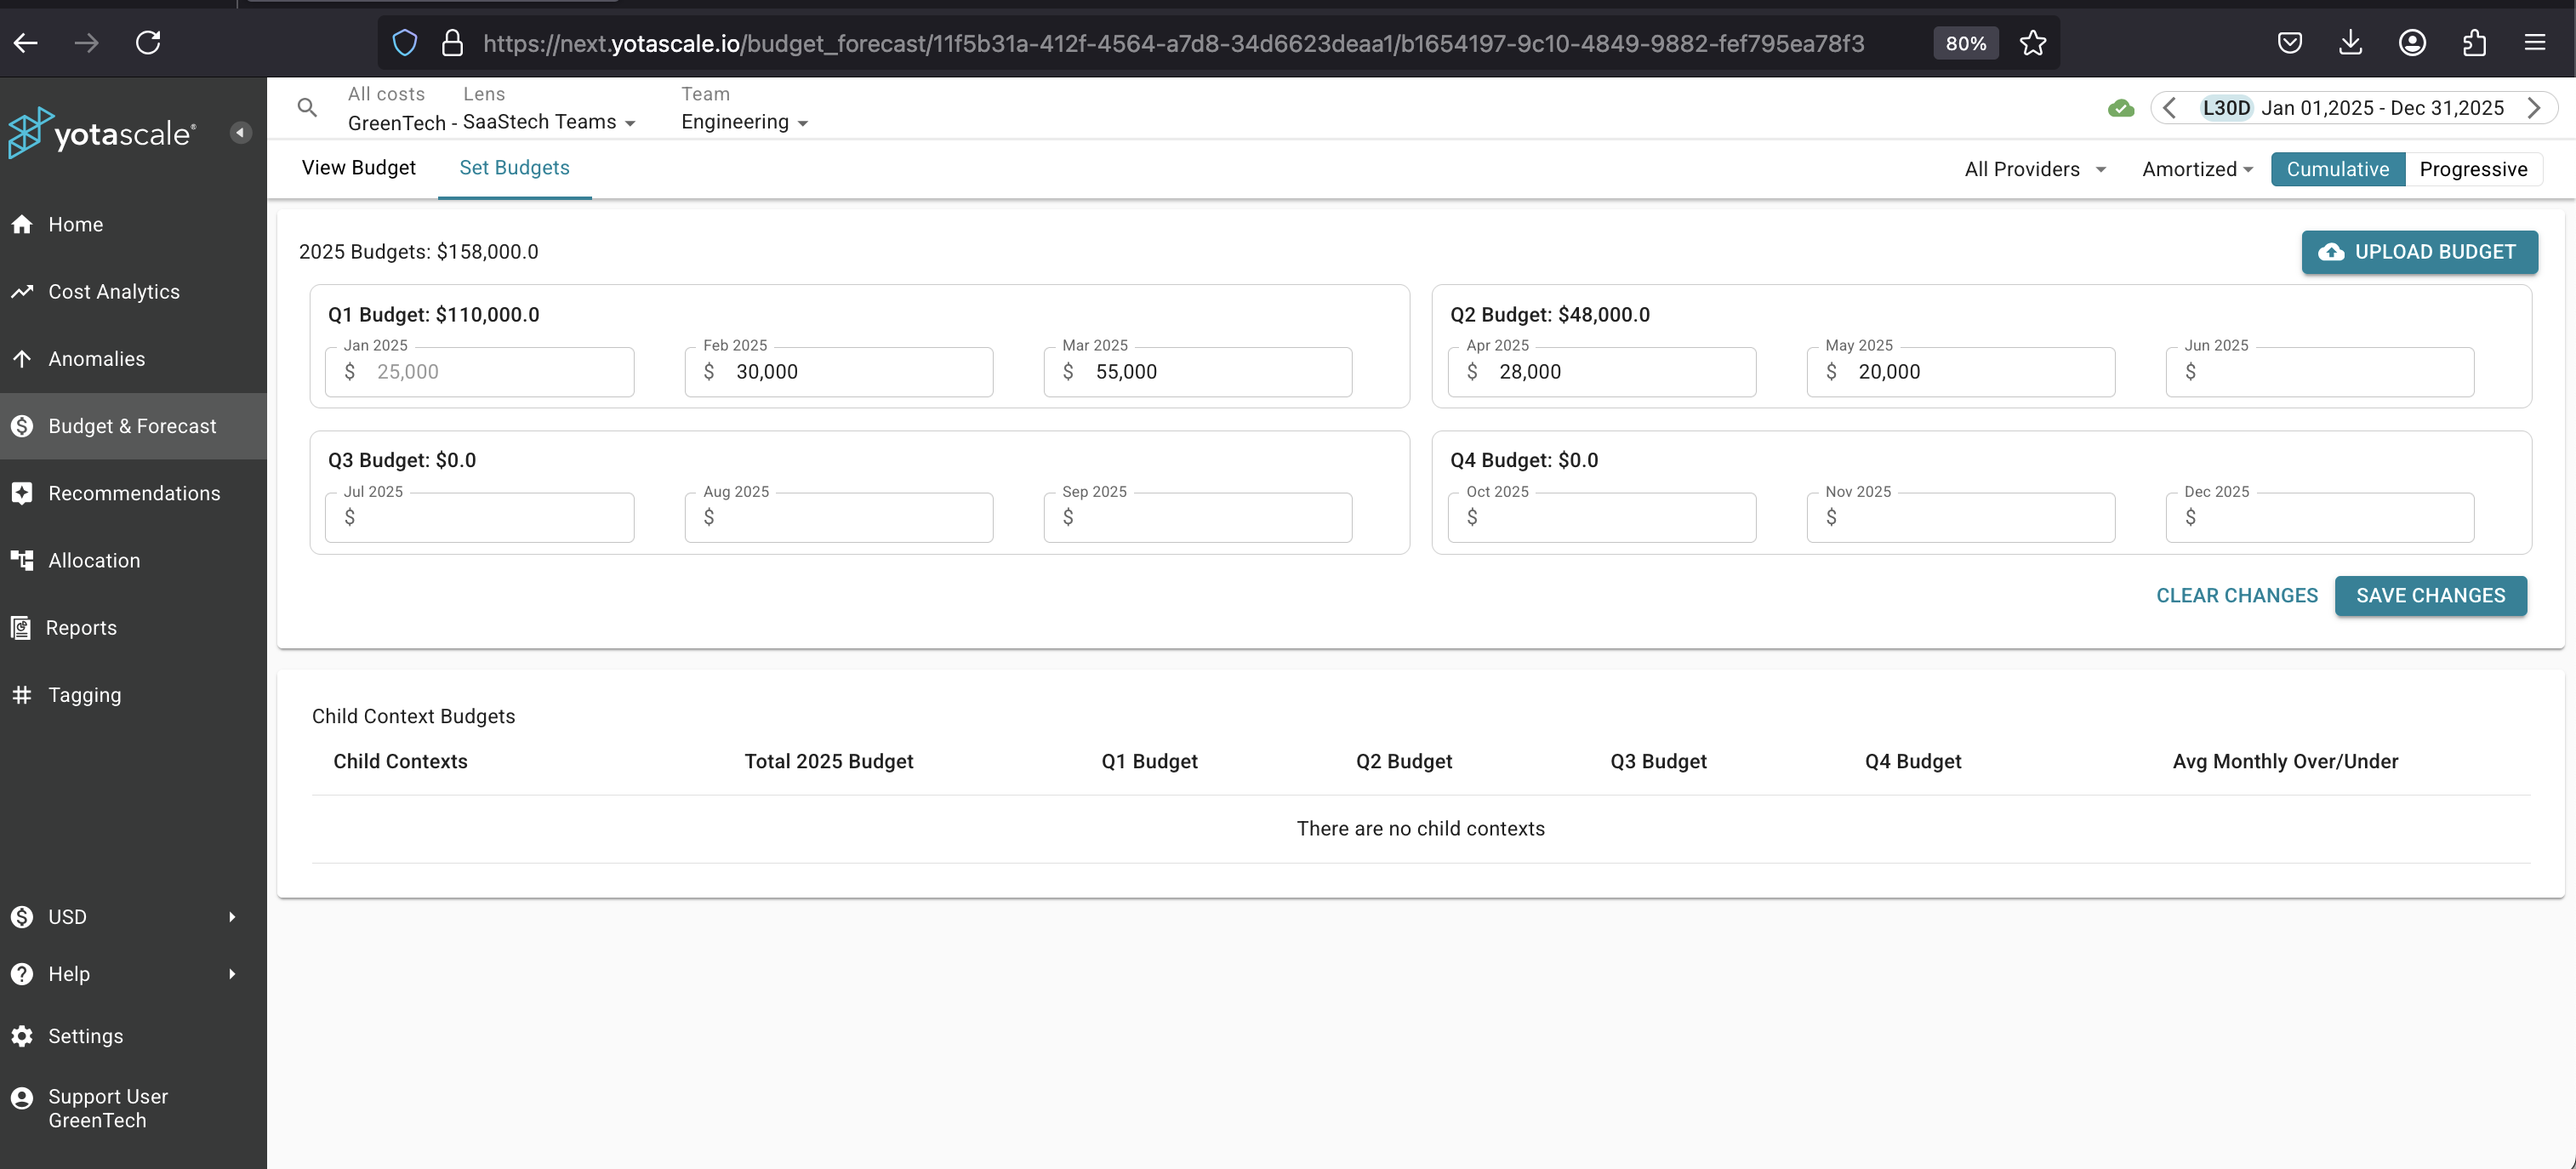
You can upload also upload a budget from a CSV file using the Upload Budget button on the Set Budgets page. The CSV file should contain the following fields:
lens_uuid[string]year[integer value with the format YYYY]month[integer value with the format MM]provider[the provide value in lowercase, orall– the tenants with only one provider should useall]budget_value[numeric value, can be in floating points, ornullif the budget needs to be removed]
The lens_uuid is unique for each context in your Lens and can be found either in app by looking at the URL - the last string after a forward slash is the lens_uuid for the current Context - or by using the API to download a Lens and getting the “id” value for each Context. In the image above, the string after the last forward slash is ‘b1654197-9c10-4849-9882-fef795ea78f3’ - that is the lens_uuid for the Engineering Context of the Lens. Using the API to download the Lens, would result in a json code block similar to the one below. Again you see that the “id” (lens_uuid) of the Engineering context is ‘b1654197-9c10-4849-9882-fef795ea78f3’.
{ "id": "11f5b31a-412f-4564-a7d8-34d6623deaa1", "name": "SaaStech Teams", "version": "v3", "status": "active", "worker_node_cost_allocation": "all_to_worker_node", "levels": [ { "name": "Team" } ], "contexts": [ { "id": "b1654197-9c10-4849-9882-fef795ea78f3", "name": "Engineering", "priority": 1000, "rules": [], } ],}
One CSV file can contain multiple lens_uuids, so it is not necessary to have a separate file for each context.
Negative Budgets
Occasionally, companies will want to have a negative budget. This feature can be useful for forecasting potential losses or managing credit-based transactions. Yotascale allows you to set a negative budget on a monthly, quarterly, or yearly basis.
When your budget is set to a negative value, some things will change within Yotascale for that time period.
Budget Alerts will be triggered when the amount falls below the negative threshold
Pie Graphs will no longer be an allowed charting method - Bar Graphs and Line Graphs will function as normal but the numerical values will range above and below zero
The line indicating the set Budget on the graph will now appear as a red line instead of blue

Negative Budget
Forecasts
We use Facebook's Prophet model to generate daily cost forecasts based on 6 months of data, producing projections for the next year. These forecasts are aggregated at the monthly, quarterly, and yearly levels.
Forecasts are automatically calculated for the top level of any Context, and for any Child Context which has a budget set. For Child Contexts that are not automatically marked for Forecast will have a link on the graph that says “RUN FORECAST”. Clicking that link will run the Forecast process for that context immediately and will also mark the context to be automatically forecast in the future.
Forecasts are calculated separately for each Context. Initially, cost data is aggregated per Context on a daily basis. We then apply a filter to remove days with anomalies, which helps smooth the data and ensures the model produces more stable forecasts, particularly for long-term predictions. The FB Prophet model handles missing values effectively, further contributing to the accuracy of the forecast.
Each Context is processed independently, meaning forecasts for one Context do not influence another. After calculating daily forecasts, they are aggregated into monthly, quarterly, and yearly values in a way that minimizes the compounding of prediction errors. Additionally, the model generates 95% confidence intervals for these predictions.
It’s important to note that forecasts at lower levels within a Lens may not sum directly to match forecasts at higher levels. This is because the cost curve at a higher level is an aggregate of the lower-level curves. During aggregation, some signals, such as recurring patterns, may become stronger or weaker, while others may cancel out. Consequently, the forecast for a higher-level Context will differ from the sum of its lower-level forecasts.
Setting Alerts
Yotascale can automatically send you alerts when you have exceeded your budget or are forecast to exceed your budget. To configure an alert navigate to the Settings panel and choose ‘Subscriptions List' from the Alerts & Subscriptions section of the menu. Then click on ‘+ NEW SUBSCRIPTION’. Choose Budget and Forecast from the 'Type’ dropdown menu and click Continue. On the next page you can choose what you would like to see in the report, when you would like to see the report, and how you would like to see the report.
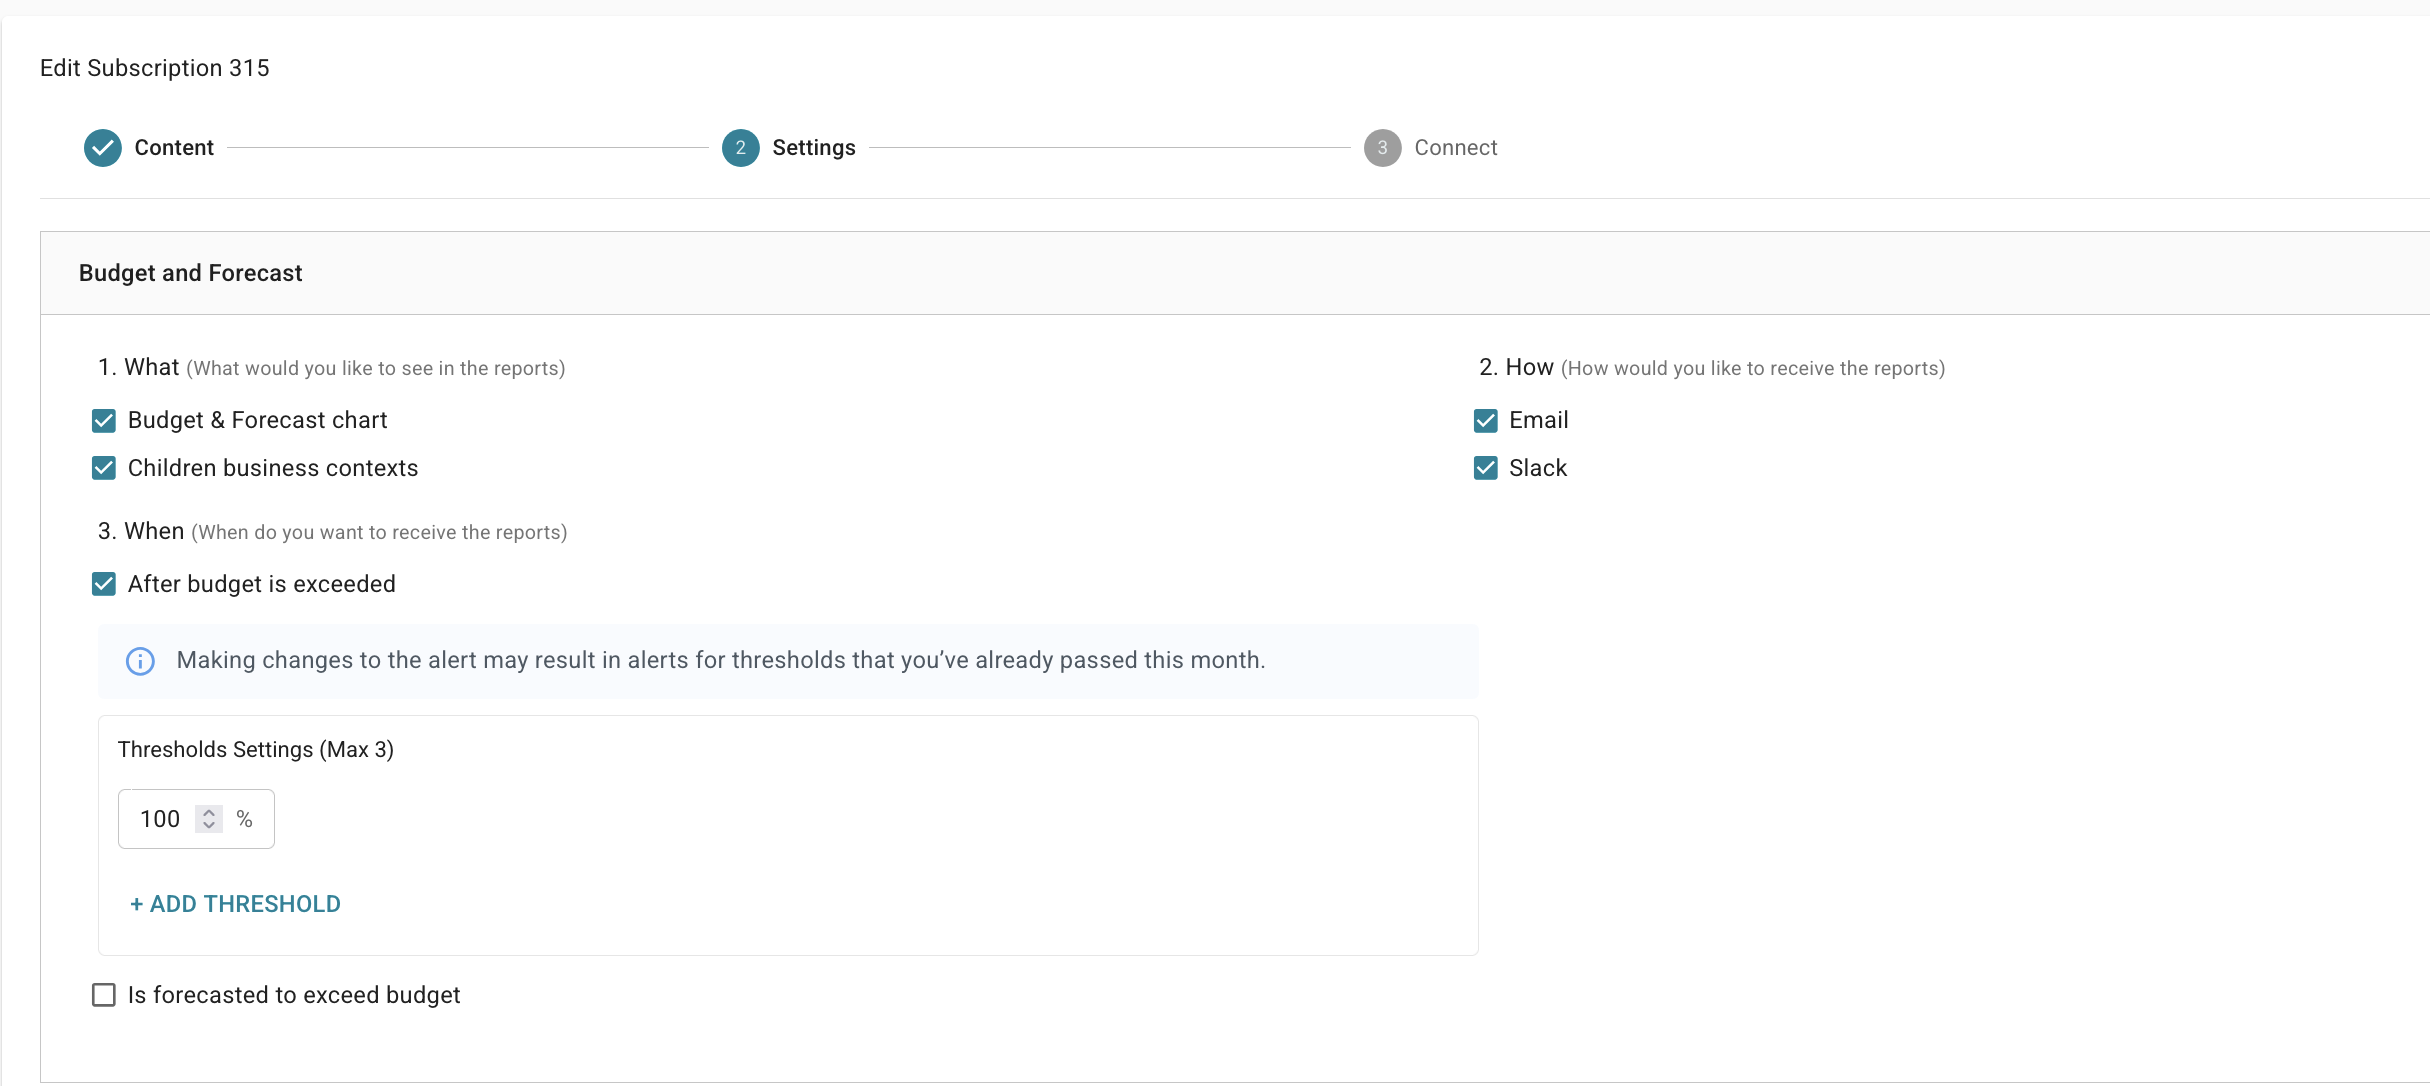
A report can be configured to send an alert when spending is forecast to exceed the budget or when spending has exceeded certain thresholds, or percentages of the budget amount. You can set up to 3 thresholds and an alert will be sent each time spending exceeds that percentage of the set budget. Threshold percentages can be any number between 0 and 200. If a spike in spending occurs overnight, such that your spending surpasses multiple thresholds, you will receive multiple alerts.
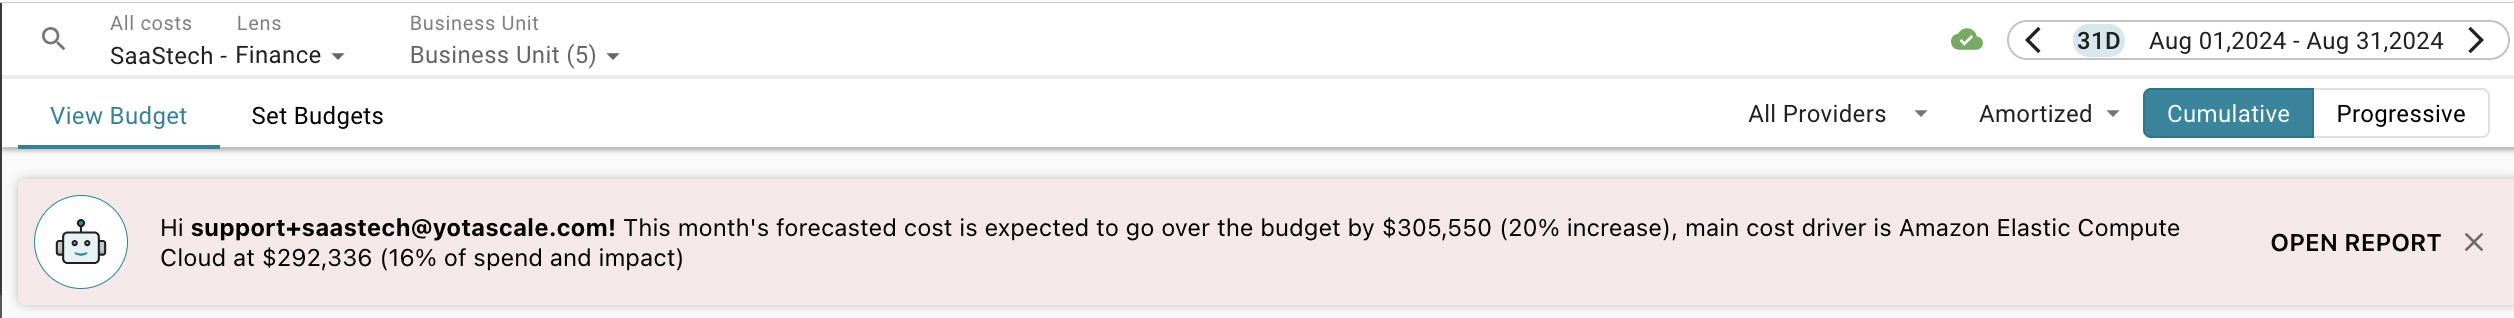
Yotascale’s Yota Copilot can also be configured to generate instant reports as you are using the app. If Copilot sees that you are exceeding your budget or are forecast to exceed your budget, a notice will appear above the chart with a brief explanation and a link to view Copilot’s more detailed analysis.
This can be configured in the Settings panel in Yota Copilot Global Settings.