Onboard EKS to Yotascale
Overview
Yotascale’s EKS Integration requires either the use of Container Insights or the installation of an agent, which is essentially a Kubernetes POD, in each of the clusters that you want to be onboarded onto Yotascale. This document describes how to install the agent onto your cluster. The document also lists some prerequisites that are required by Yotascale.
The Yotascale Kubernetes agent is compatible with the following set of components:
Kubernetes 1.17.x or newer
kube-state-metrics 1.5.0 or newer
CAdvisor 0.33.2 or newer
Follow the steps below for installing the agent onto each of your Kubernetes clusters.
Onboarding EKS with Container Insights
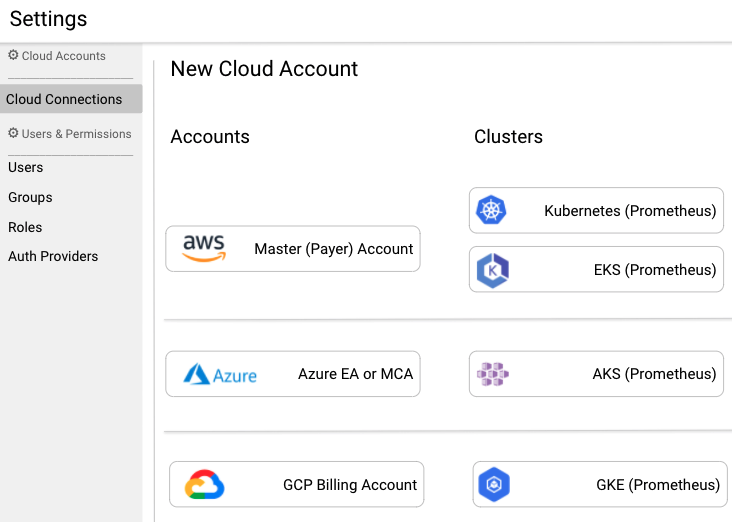
Login to Yotascale and click on “Settings” and then on “Cloud Connections”
Then click “New Account” and select EKS

Select the EKS Clusters that you want to onboard.
Installing the Yotascale Agent in your cluster
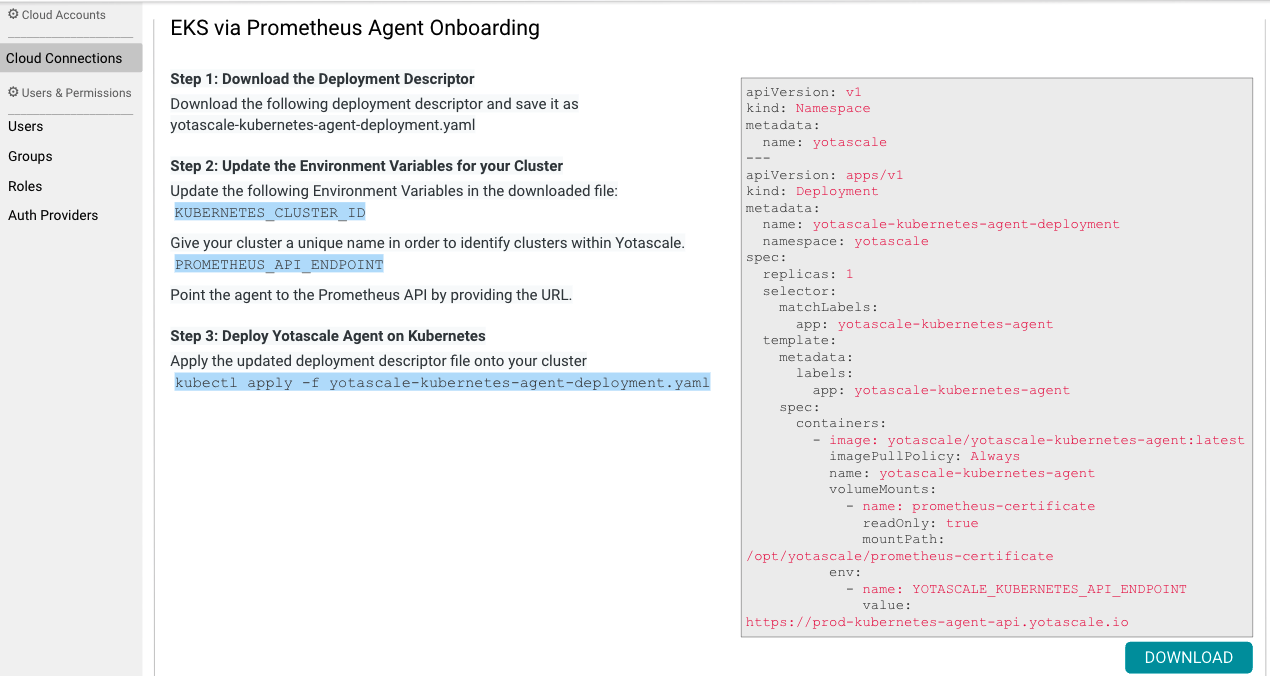
Click on the DOWNLOAD button to download the yaml file.

Step 2: Update the Environment Variables for your Cluster
The deployment descriptor lists multiple environment variables in the last few lines of the file. You would need to configure some of them according to your environment.
Environment Variable | Description | Value needs to be specified |
|---|---|---|
KUBERNETES_CLUSTER_ID | Give your cluster a unique name in order to identify clusters within Yotascale. | Yes |
PROMETHEUS_API_ENDPOINT | Point the agent to the Prometheus API by providing the URL. | Yes |
YOTASCALE_API_KEY | This Environment variable authenticates (and identifies) this agent against a Service Role that your administrators have subscribed to by default. This will be pre-populated in the deployment descriptor and does not need to be updated by the user. | No |
YOTASCALE_KUBERNETES_API_ENDPOINT | This is the URL of the Yotascale API that allows the agent to authenticate iteself with Yotascale, and send frequent heartbeats for monitoring. This URL will be pre-populated in the deployment descriptor. | No |
Step 3 (Optional): Create Self-Signed Certificate Secret for calling Prometheus API
If your Prometheus is using a self-signed certificate, you would need to create a Secret with your PEM file and mount the Secret as a Volume and file on the Pod. The agent would use this certificate when making calls to Prometheus.
Create a Secret named ‘prometheus-certificate’ using the following command. The certificate could be named anything.
kubectl create secret generic prometheus-certificate \
 --from-file=/path/to/certificate.pem --output=yaml --namespace yotascale
When the Pod is up and running, the certificate is mounted at the following location
/opt/yotascale/prometheus-certificate/certificate.pem The following Pod logs would show that the agent is using the self-signed certificate
Prometheus cert for Cluster my-cluster found at location /opt/yotascale/prometheus-certificate/name-of-your-cert.pemPrometheus Certificate found at /opt/yotascale/prometheus-certificate/name-of-your-cert.pem for Cluster my-cluster. Verifying using custom cert.Step 4: Deploy Yotascale Agent on EKS
Once you have updated the deployment descriptor, apply the updated file to your cluster
kubectl apply -f yotascale-kubernetes-agent-deployment.yamlStep 5: Verifying the Installation
Once you have applied the deployment descriptor to your cluster, you will see it appear in the List of Clusters widget on the Settings - Cloud Connection page.

You can also look at the logs from the agent to ensure there are no error logs.
kubectl logs -l app=yotascale-kubernetes-agent -n yotascaleMetric Ingestion from Prometheus
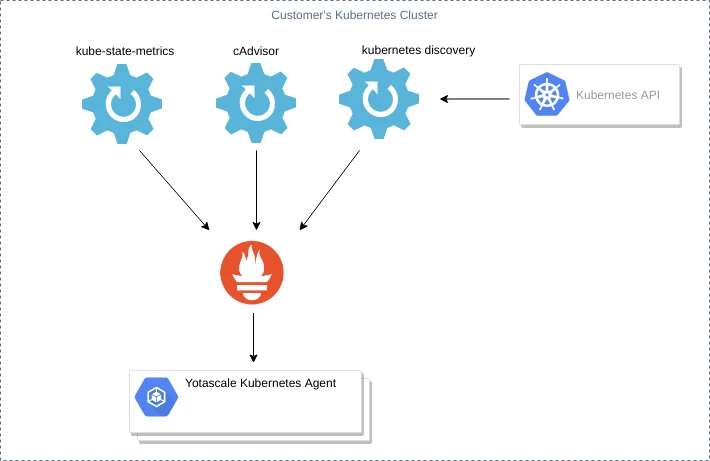
The Yotascale Kubernetes Agent assumes the existence of a Prometheus installation for your cluster. Furthermore, it assumes that Prometheus is scraping kube-state-metrics and cAdvisor, two common tools for capturing cluster and container-level metrics.

The Yotascale agent uses the following metrics:
kube-state-metrics Metrics
The following metrics enable Yotascale to build a layout of your Kubernetes cluster, determine the relationship between various Kubernetes objects, and understand resource requirements.
Metric Name | Description |
|---|---|
kube_node_info | Provides information on the nodes running in the cluster. This includes the "provider id" which contains the resource id of the AWS EC2 instance which corresponds to the Kubernetes node. |
kube_node_labels | Provides information about the node such as the instance type e.g c4.xlarge, the region, the availability zone, the os, and the role (master/node) |
kube_pod_info | Provides information on the pods running on the clusters including the name of the nodes the pods are running on |
kube_pod_labels | Provides label information for pods. |
kube_pod_container_info | Provides information on the containers running under each pod. |
kube_pod_container_resource_requests_memory_bytes | Requested memory for the container |
kube_pod_container_resource_requests_cpu_cores | Requested CPU cores for the container |
kube_pod_container_resource_limits_memory_bytes | Upper limit usage for memory usage for the container |
kube_pod_container_resource_limits_cpu_cores | Upper limit usage for CPU cores for the container |
kube_deployment_labels | The list of deployments and their basic metadata such as namespace |
kube_replicaset_owner | Name of the deployment that creates each replica set. |
kube_pod_owner | Name of the replica set or daemon set that creates each pods |
kube_hpa_labels | Identify the HPA. Map to namespace. |
kube_hpa_spec_max_replicas | Max Replicas configured in the HPA |
kube_hpa_spec_min_replicas | Min Replicas configured in the HPA |
cAdvisor Metrics
The following metrics enable Yotascale to determine actual resource usage for each of your containers.
Metric Name | Description |
|---|
Metric Name | Description |
|---|---|
container_memory_usage_bytes | Actual memory usage by a container |
container_cpu_usage_seconds_total | Actual CPU core usage by a container |
Release Notes
0.1.7
docker pull yotascale/yotascale-kubernetes-agent:0.1.7
The labels "pod_name" and "container_name" have been removed from cAdvisor metrics in Kubernetes 1.16 and are now available as "pod" and "container". The agent now has support for both metric names.
Added the ability to upload detailed logs to Yotascale allowing Yotascale to show logs and detailed agent status on the UI (as part of a later release of the UI)
