
Reports Dashboard
Overview
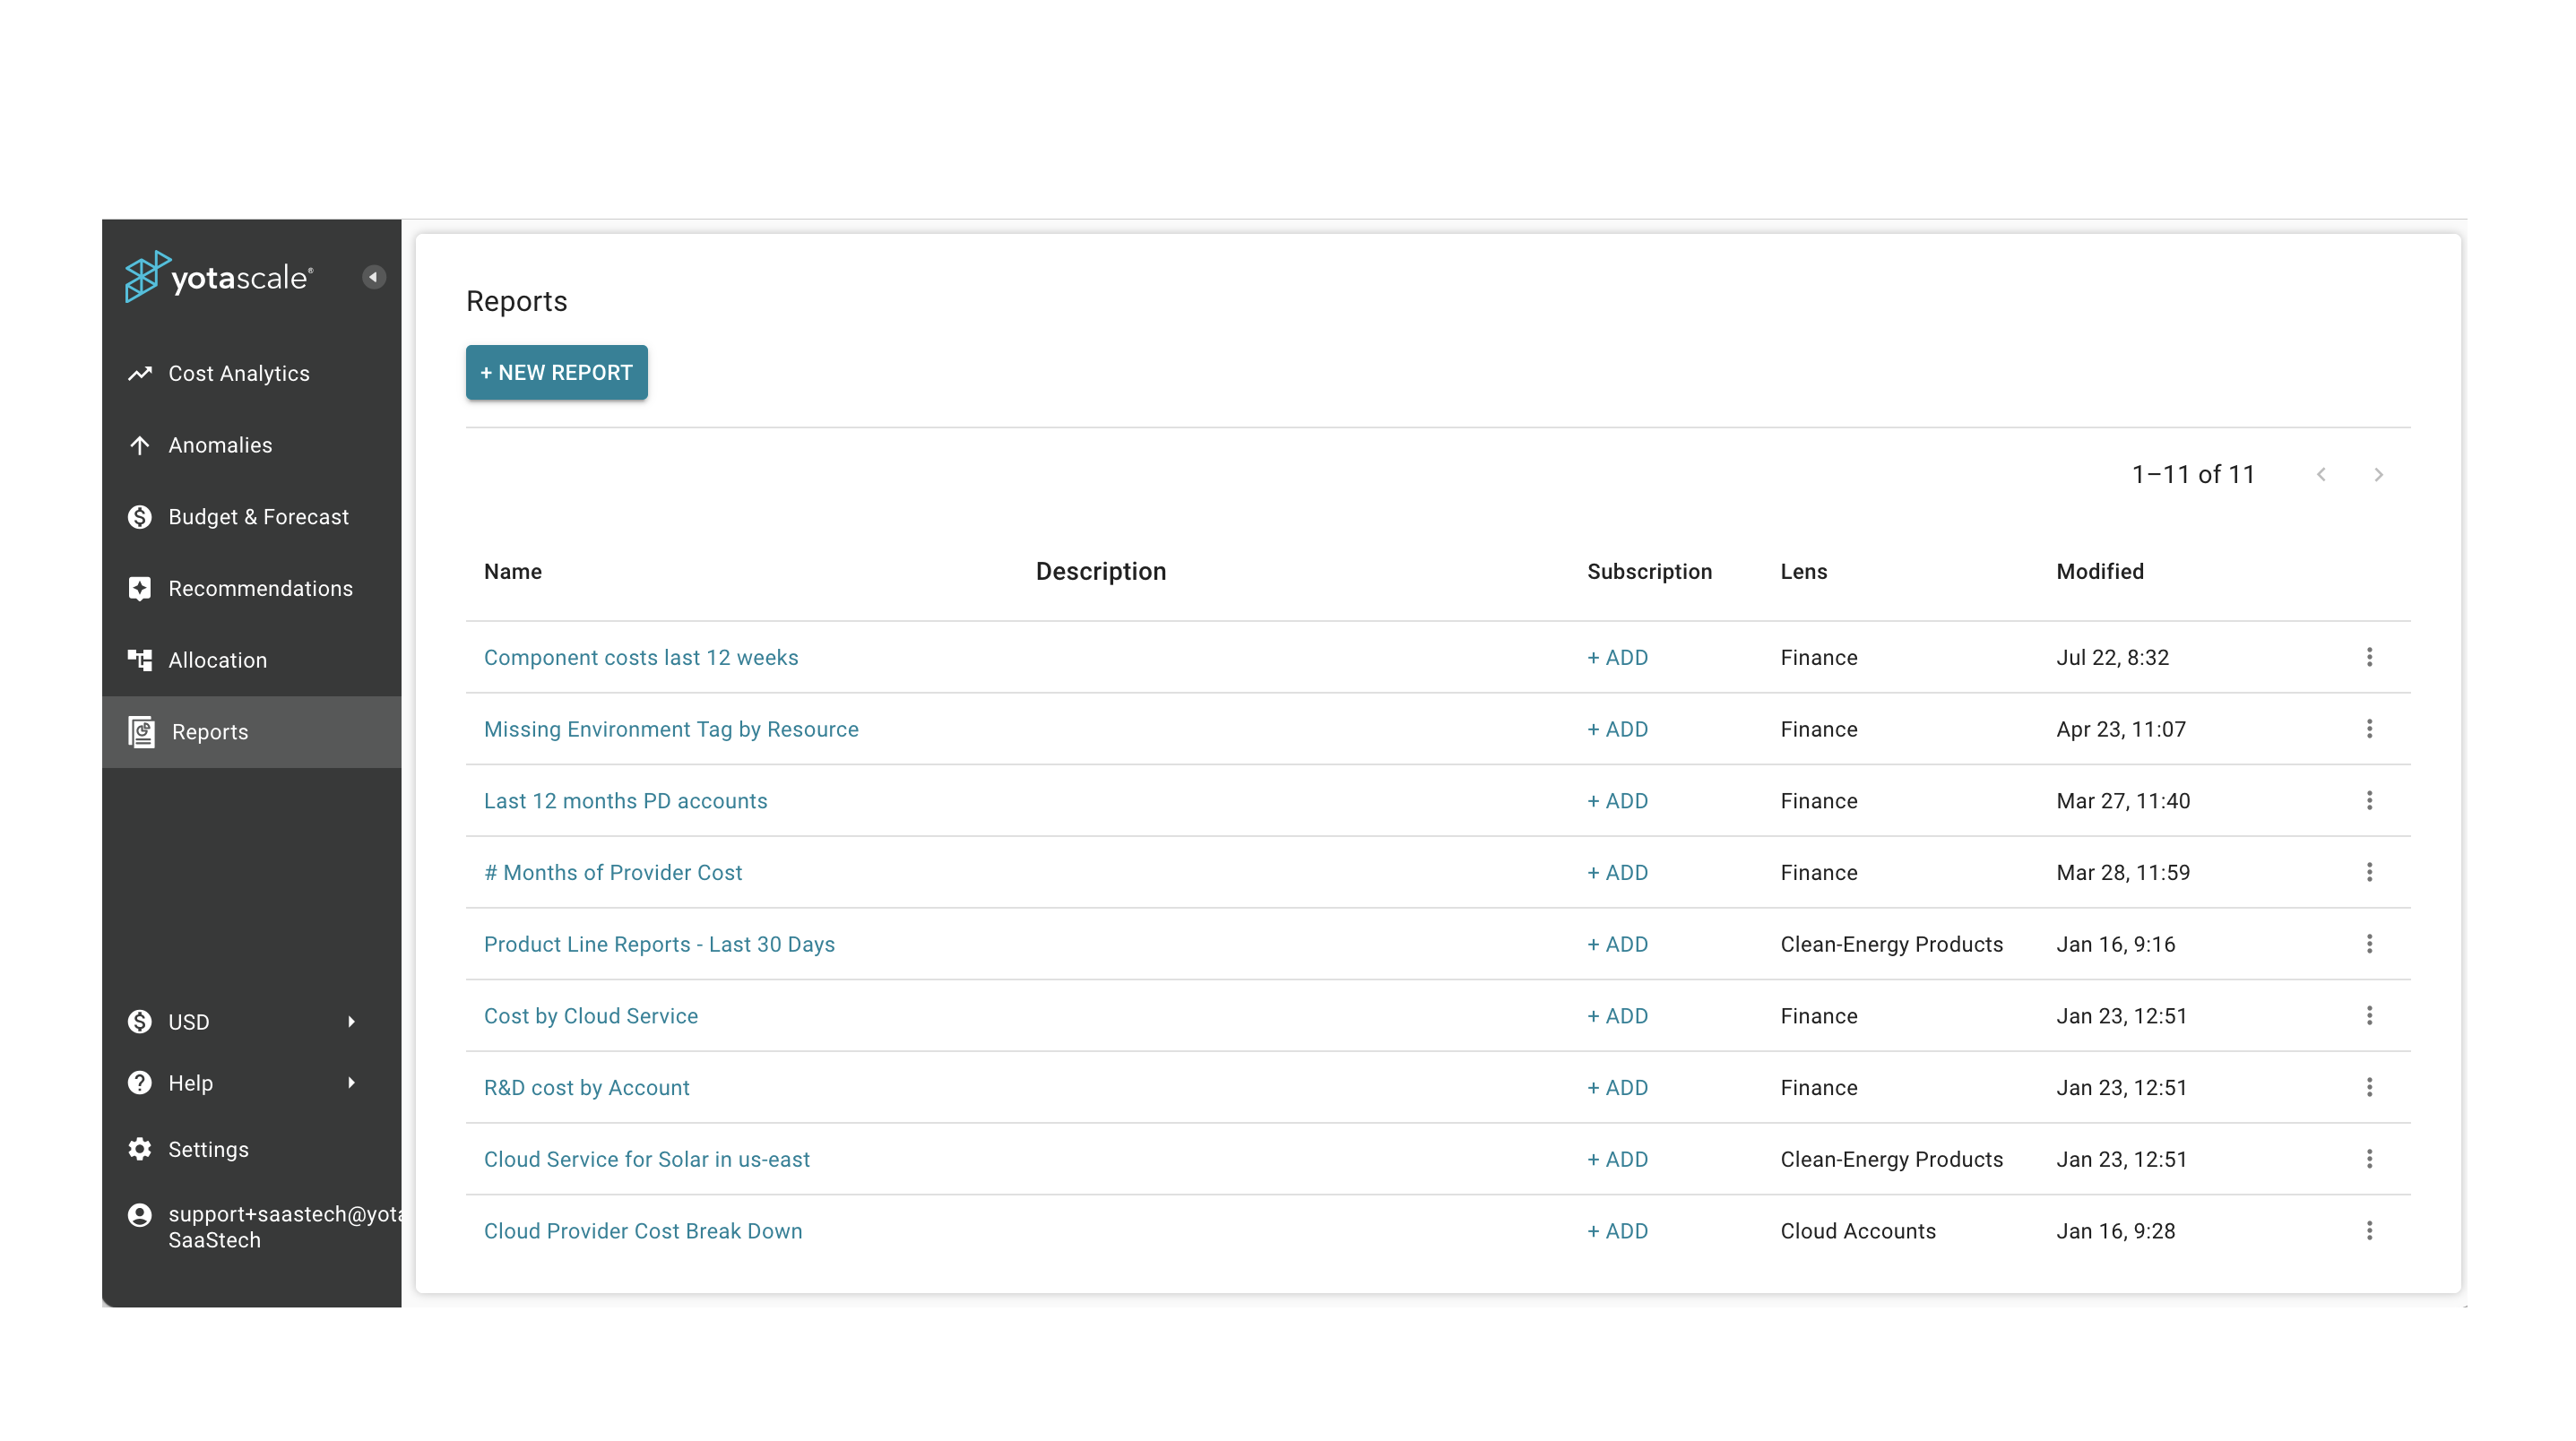
In addition to the weekly Cost Analytics Report and Budget Report that you can subscribe to in the Settings menu, Yotascale will allow you to make a Custom Report for any widget that you like. A list of the Custom Reports that have been created can be found in the Reports Dashboard. Each report will list the name of the report, what Lens was used to create the report, and the last date it was modified. Reports may also have a description of what the report is meant to show if the user added one. The 3 dots on the right of each row will bring up a menu that allows you to edit the name and description of a report or delete it if it is no longer needed. You may create as many custom reports as you need and all reports will be available until they are deleted.
Viewing Reports
To view the list of custom Reports, click on the Reports link on the left hand menu. If you do not see a Reports link that means that you do not have Read Access to Reports and you will have to access your Yotascale Admin for access. It’s important to note that the list of Reports you can view on the Reports page is not an archive of past Reports, but rather an instruction set to Yotascale’s backend on how to create the Report. For a Report with a dynamic date range (last 7 days, for example), the Report will be different if you click on the Report’s link on a different day. For a Report with a static date range (like May 1 - May 31), every time you click on the Report link you will see the exact same data.
Clicking on any of the Report titles will bring up a view of the widget in the Report with all of the configurations as specified when the Report was created. You can change any of the parameters of the Report, such as the date range, switch from a cash view to an amortized view, etc. When you have made any changes, you will be able to click on the ’Save' icon to update the Report configuration; or click on ‘Clear’ to return to the original configuration.
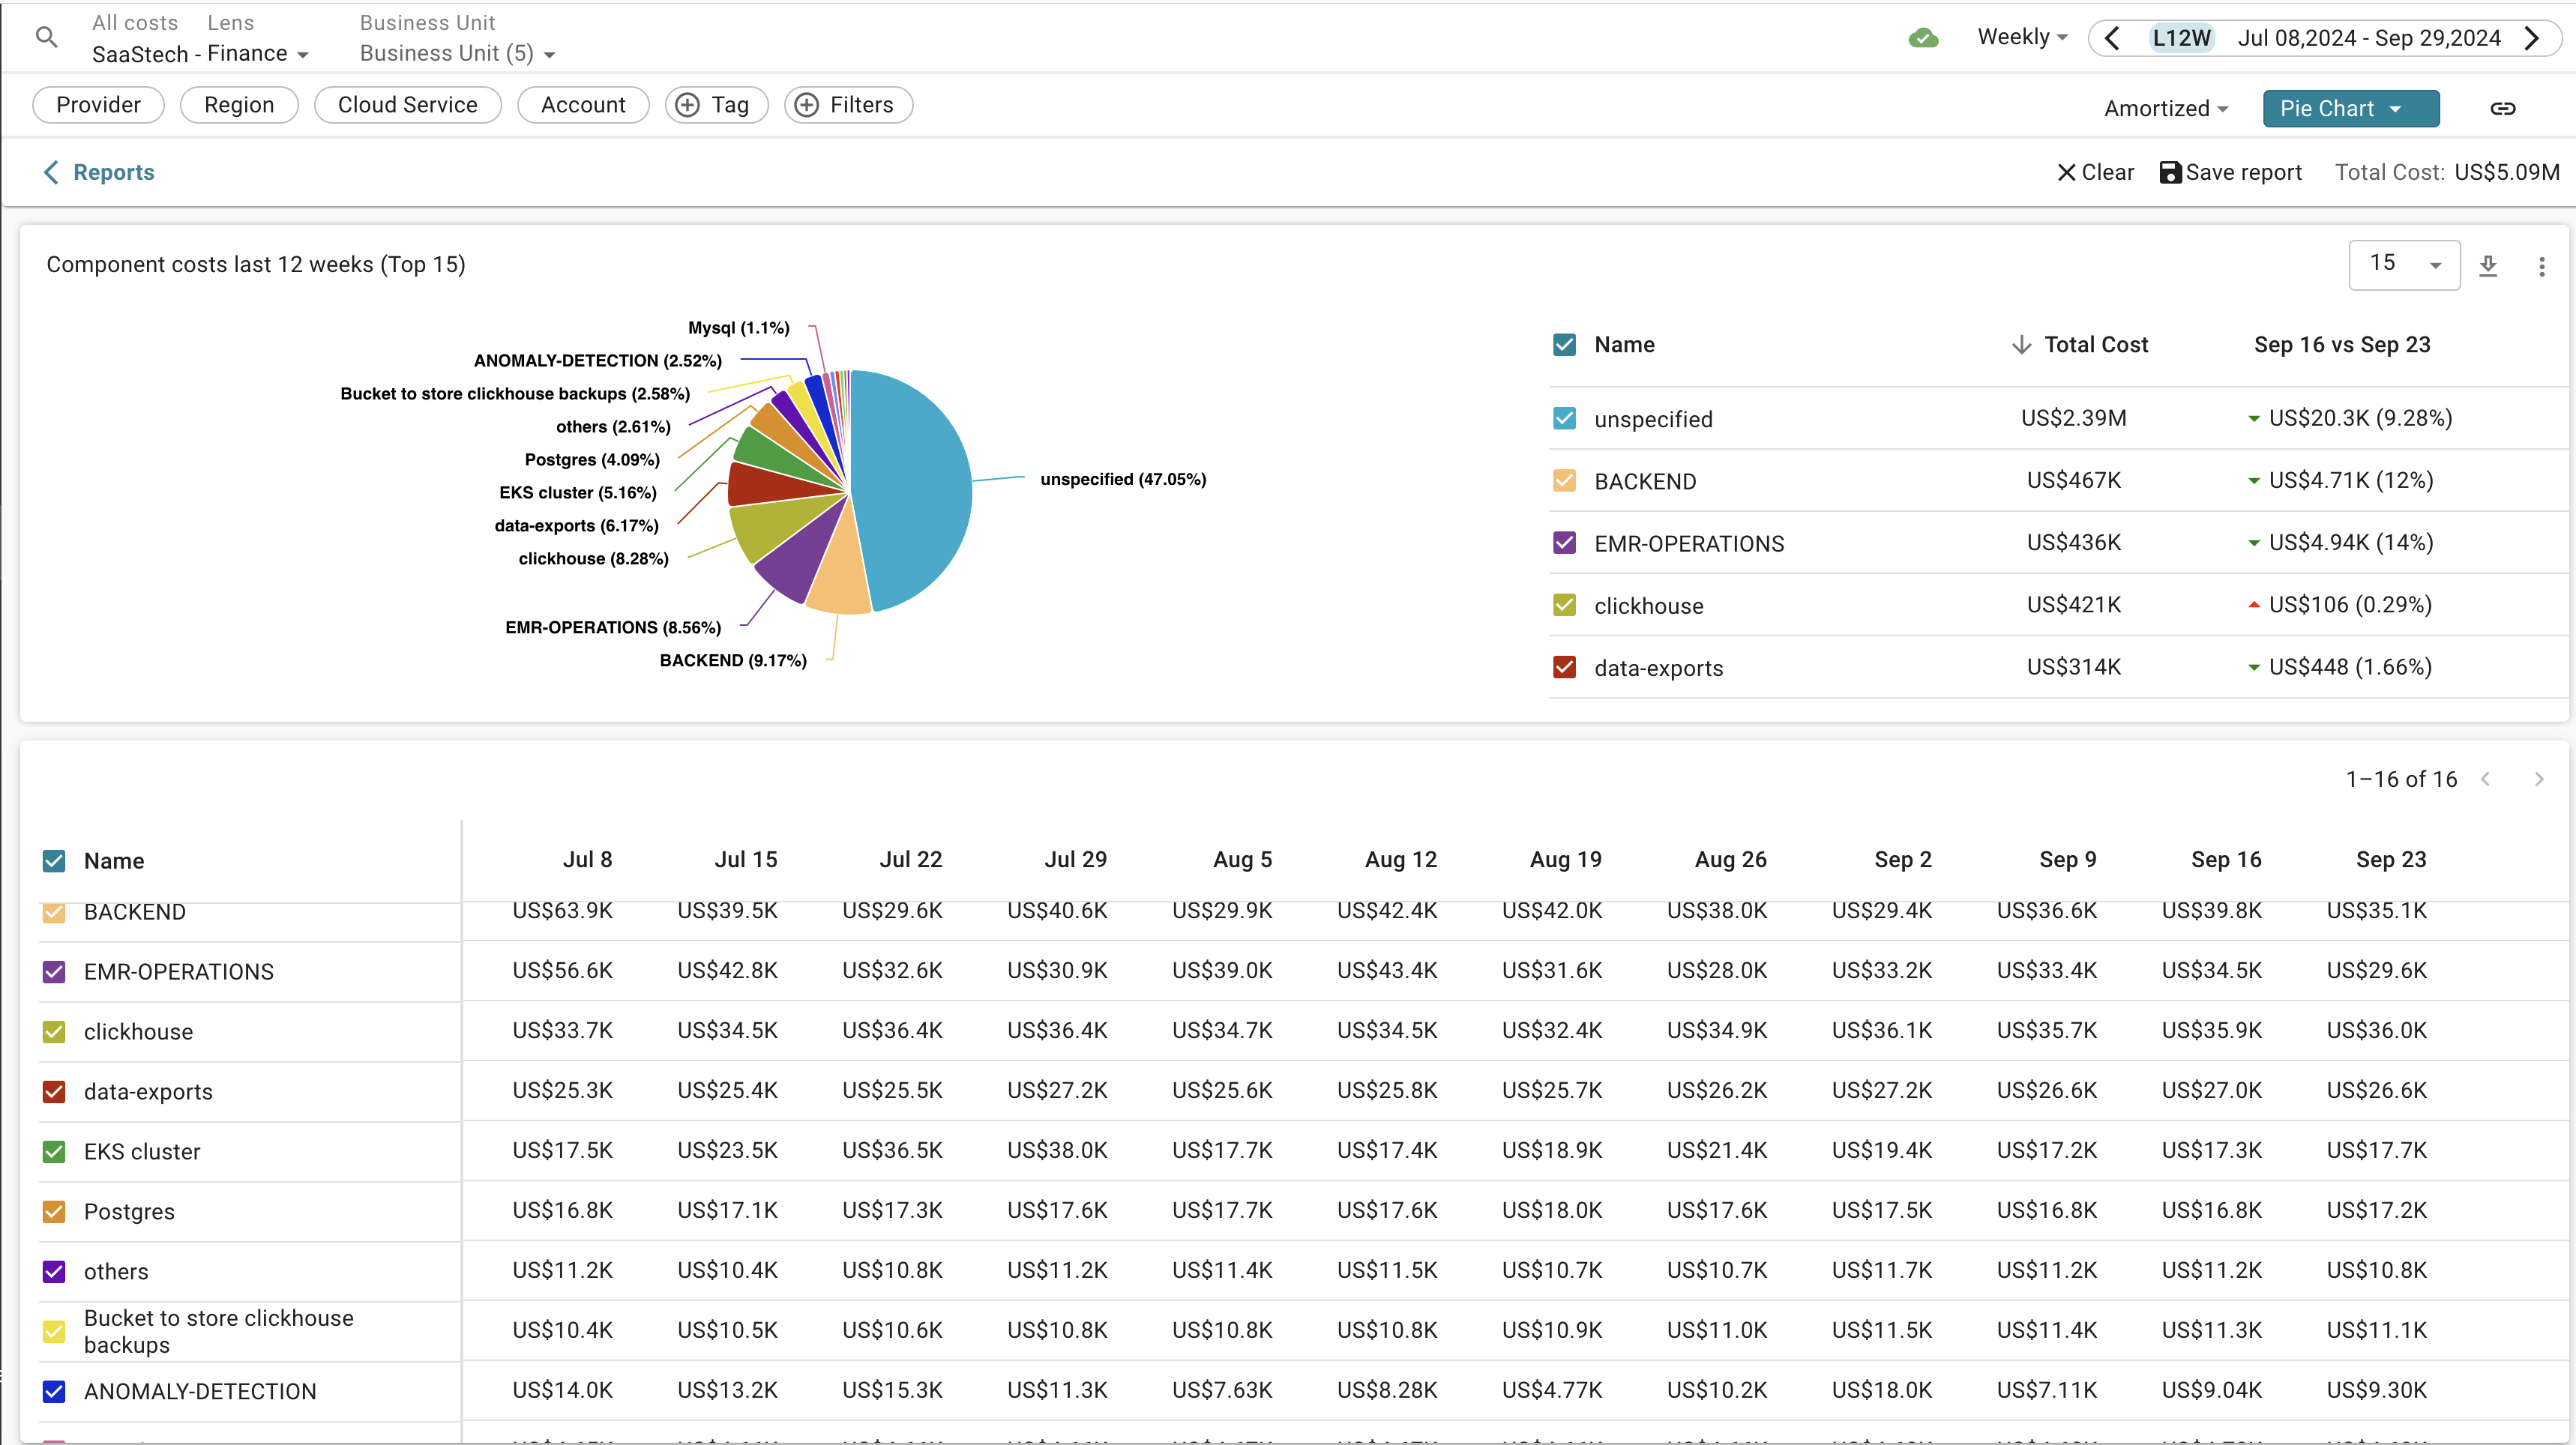
You will also see a link button in the top right of the screen, that will copy a link to the current configuration to your clipboard. You may then send that link to anyone who has read access to the same Report in Yotascale and they will be able to see the Report as it was when you clicked on the link. NOTE: The link copied to your clipboard contains the current configuration settings at the time the link is created; if you continue to make changes to the Report after you have clicked the link button those changes will not be seen by anyone using the copied link to the Report unless you save the Report again. The link will be active for 30 days from the time of creation.
To share a report with someone outside of Yotascale, you can use the downward pointing arrow on the upper right of the screen to download a copy of the Report in PNG, SVG, CSV, or PDF formats. PNG format will give you an image of the graph and table at the top of the screen; SVG format will give you an image of just the graph; CSV format will give you the first 2 columns of the table at the top of the screen, and PDF format will give you both the top and bottom panes of the Report.
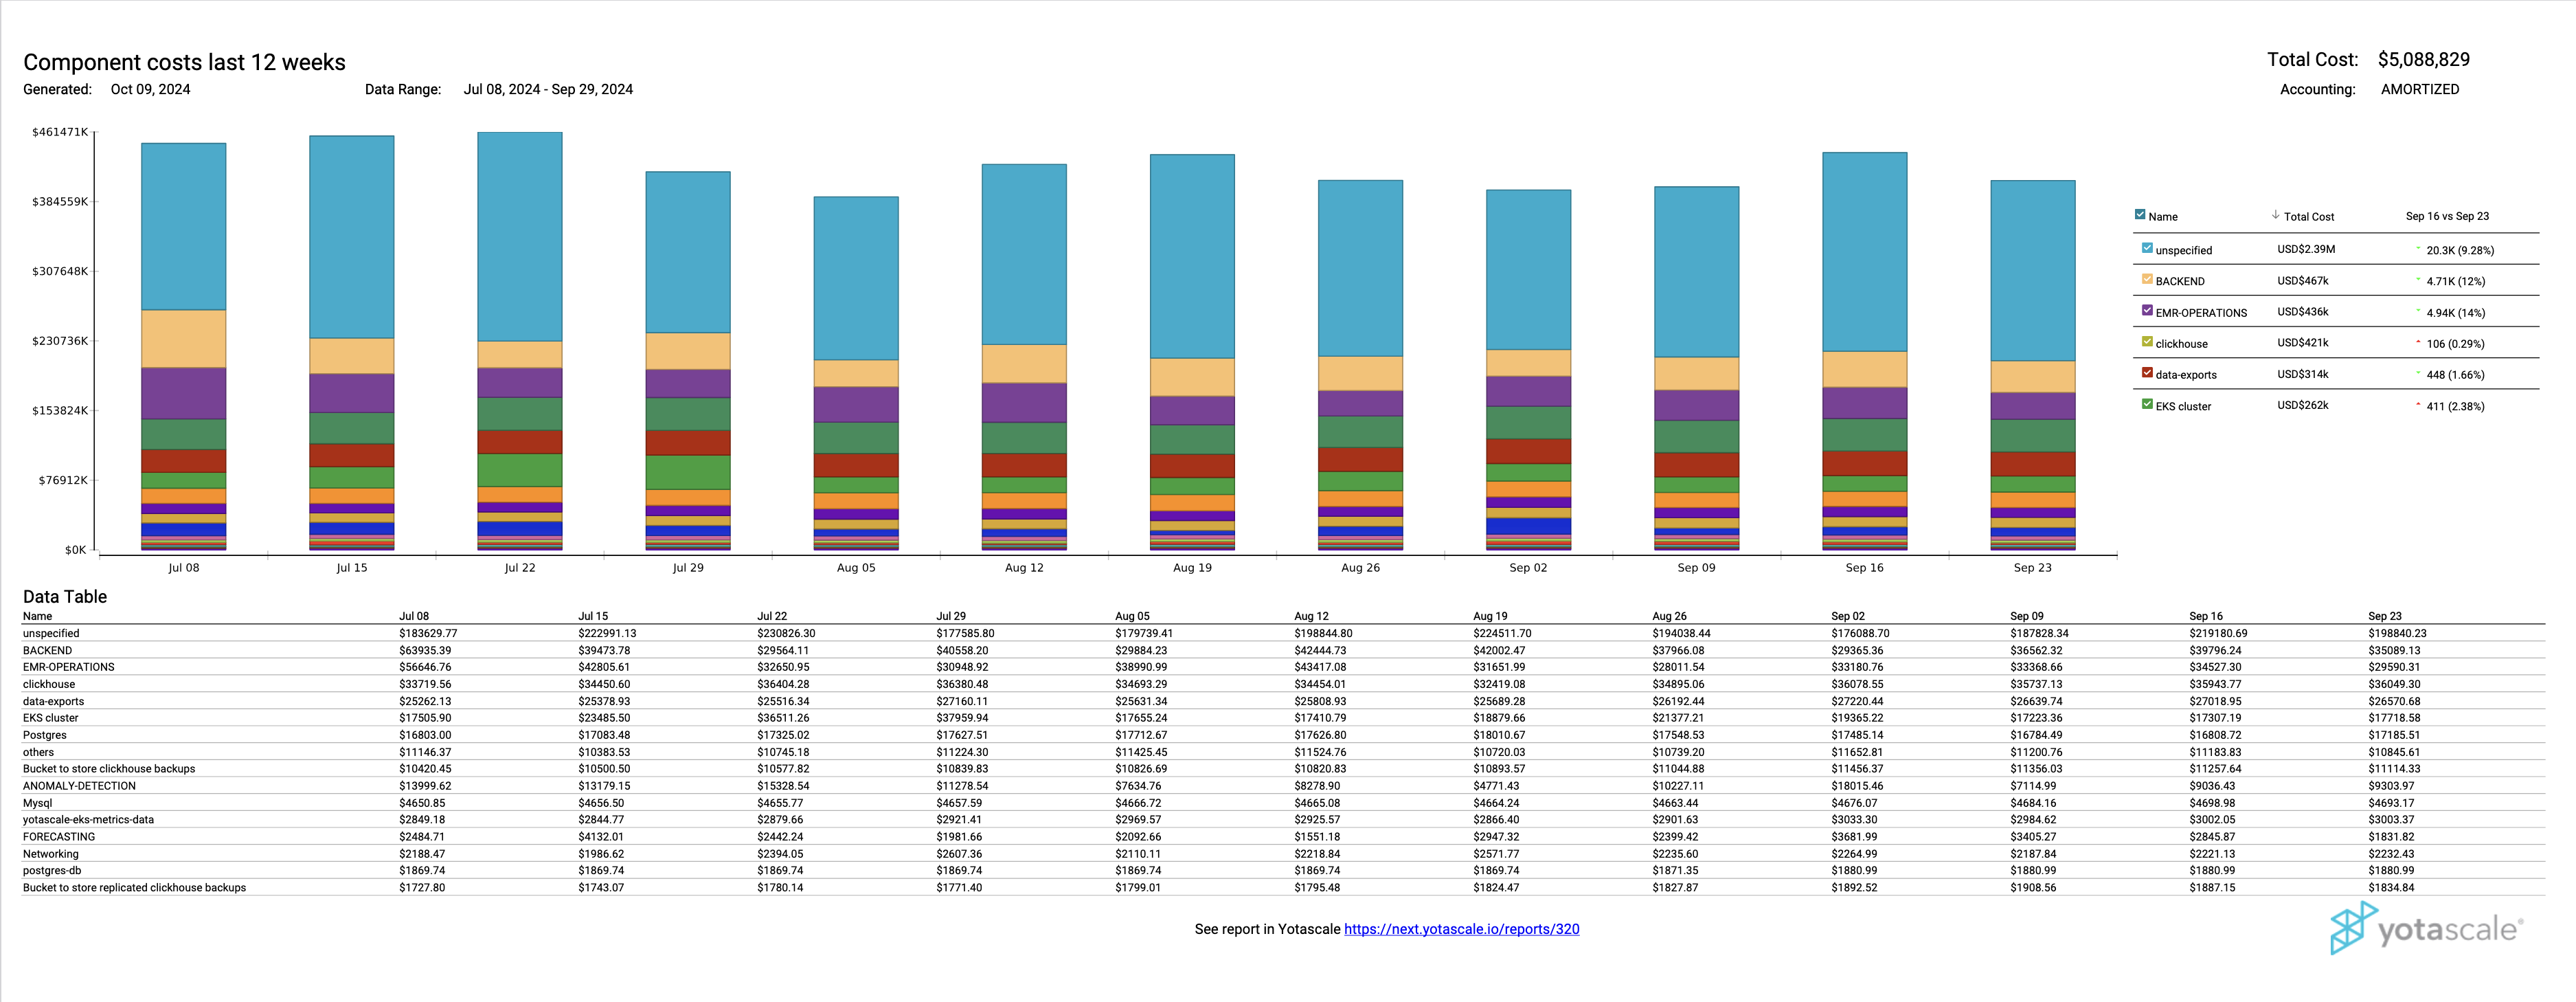
report in pdf format
NOTE: Downloading a report in PDF format will download the saved version of the information. If you have made changes to the settings and have not saved those settings, the PDF version of the Report will match the Saved version rather than the view that you see on your screen.
Creating a New Report
To Create a New Report, go to the Cost Analytics Dashboard, select the Lens and Contexts that you want the Report to focus on, choose any filters that you want to use and choose the date range for the Report. NOTE: If you choose a specific date range instead of a dynamic range (January 1 - March 31 vs. Last Complete 3 Months, for example), every time the report is run it will collect data for the specific dates listed. If you intend to create a report that is run on a regular basis with up to date data, make sure to choose a dynamic date range that covers your needs.Change any other settings that you want to alter the way the data will be shown like the type of chart used, whether on not to show amortized costs, which currency to use (if applicable), whether to use fiscal year or calendar year for yearly reports, and the granularity of the data over the date range (daily, weekly, etc.).
When you have everything set to show the data that you need for your report, click on the three dots in the upper right of the widget you want to have a report on and choose “Create Report”. Give your Report a unique name and add a description (optional) and click “Save”.
Adding a Subscription to a Report
Sometimes you may wish to receive a report on a regular basis. There are 2 ways to add a subscription to a report. The easiest way is to click the “+ADD” link in the report listing. That will take you to the Settings area and you will already be on Page 1 of Adding a New Subscription, since you are adding a subscription to a specific report these fields have already been filled out for you so Click on Continue to get to Page 2. You’ve already chosen which Report you want to receive by clicking on it’s “Add” button, so choose the frequency; format, and how you would like to receive the report (Email or Slack). Then click ‘Continue’ again to get to Page 3 where you will add the list of comma separated email addresses and/or Slack Channel and Webhook information for delivering your Report. Then click on ‘SAVE’ and your subscription will be active.
The other way to add a subscription is to go through the Settings area. Choose Subscriptions List from the Alerts & Subscriptions section and then click on “+ NEW SUBSCRIPTION”.
On Page 1, you’ll choose Reports from the Type field, then click on Continue to get to Page 2. There’s a drop down menu in the ‘What’ section which lists all of the Reports that have been created. Choose which one you want a subscription to, the frequency and format for delivery, and whether you want the report via email, Slack, or both. Then click ‘Continue’ again to get to Page 3 where you will add the list of comma separated email addresses and/or Slack Channel and Webhook information for delivering your Report. Then click on ‘SAVE’ and your subscription will be active.