Tagging Dashboard
Overview
When you send your data to the cloud provider, you can add tags, or labels, to your resources to make it easier to track costs. These tags are in addition to the ones that the cloud service provides. But, what happens when different teams use variations of the same tag due to misspellings or not knowing that a similar tag was already in use? You could end up having to sort not only by “Product”; but also by “Prod”, “product”, “prod”, and event “prodcut”. That’s where Yotascale’s Tagging feature comes in. It’s a way to gather all of these different tags into one Tag Group that you can use to sort the costs instead of by the different variations. Global Admins will be able to create and edit these Tag Groups to streamline the cost allocation rules.
Viewing Current Tag Groups
To view the current Tag Groups, simply click on Tagging in the Navigation Menu on the left side of the screen. That will bring up a page similar to the image below.

For each of the current Tag Groups, you can see what Tag Keys are mapped by that group, the Coverage Health of the group and how many of the current resource ids have a tag that is within that group. The Coverage Health is a bar graph that shows on a daily basis what percentage of the resource ids from that day had a tag that would be mapped by the Tag Group. The bars are color coded to match the percentage:
A red bar means that less than 50 % of the Resource IDs matched with the Tag Group
A yellow bar is between 50 % and 80 %
A green bar means that more than 80% of the Resource IDs matched with the Tag Group
Under the Actions menu for each row, you can Edit the Tag Group to change its name; or Normalize Keys to add additional tags to the Tag Group.
Normalizing Keys

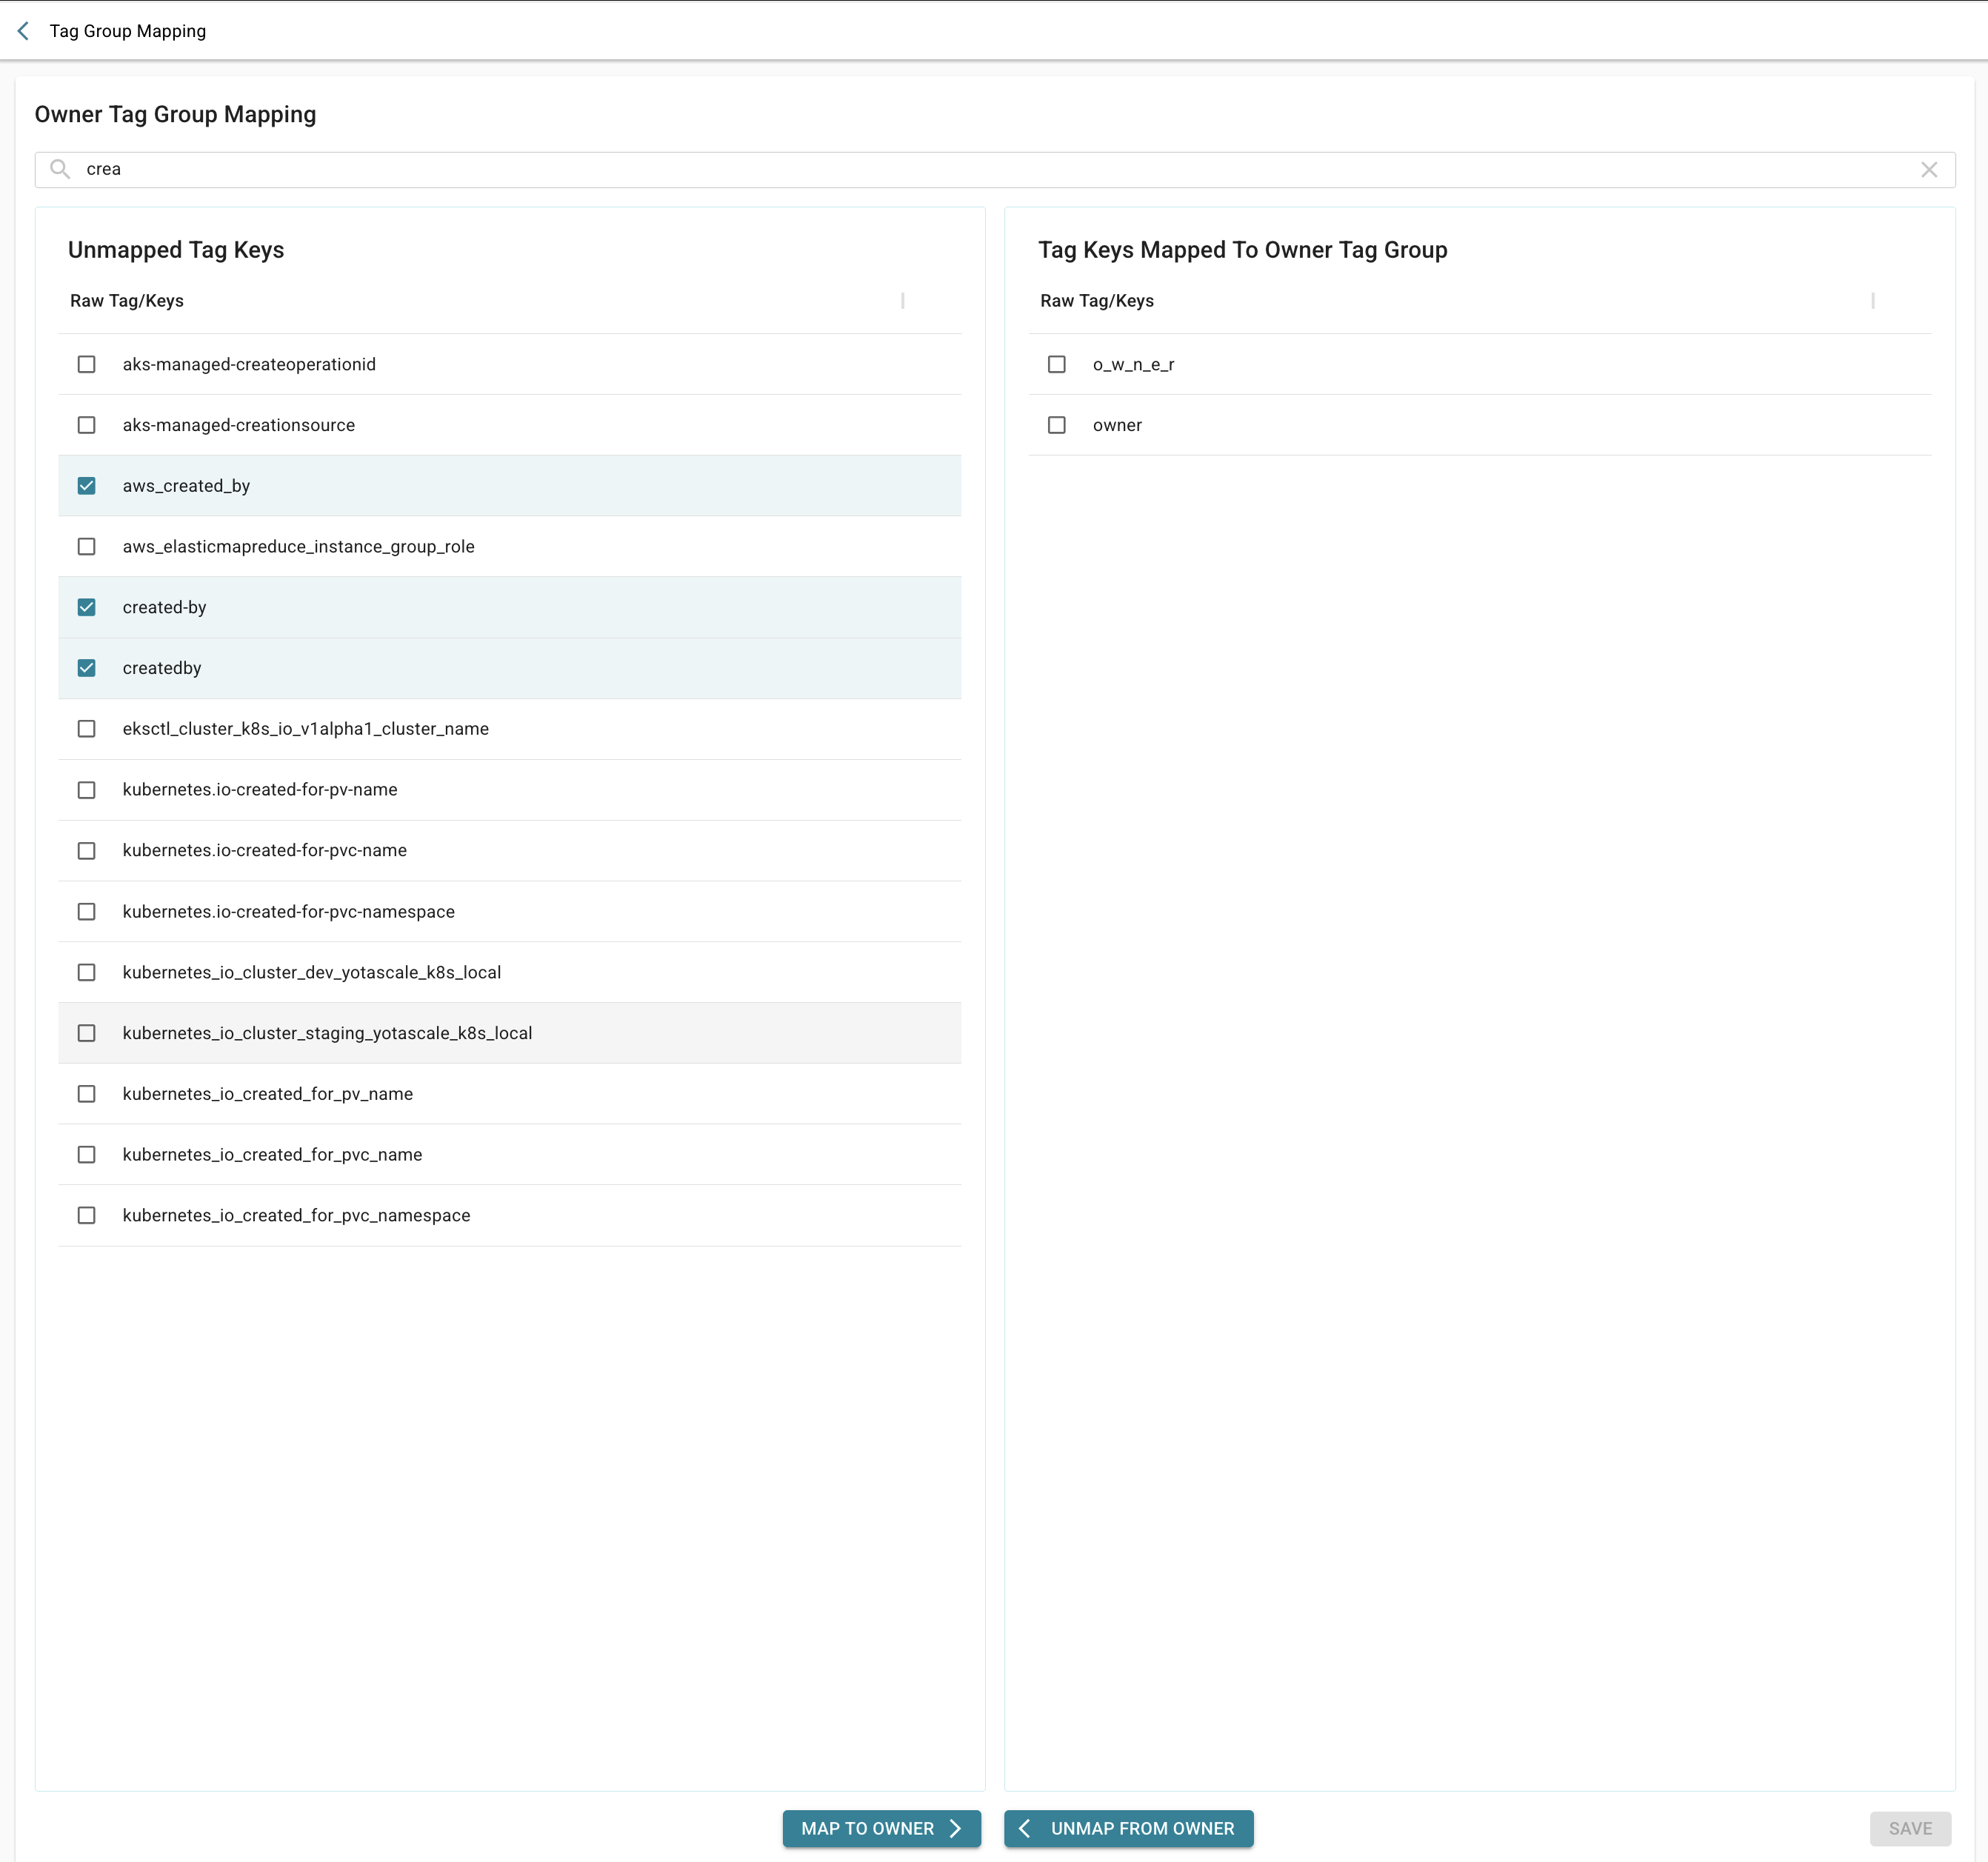
When you choose “Normalize Keys” from the Actions Menu, it will bring up the Mapping Page. In the left column are all of the Unmapped Tag Keys. Use the search bar to find the tags you wish to add to the Tag Group and select them from the list. When you have selected all of the tag keys to add to the Tag Group, click on the button at the bottom of the column to map those keys to the current Tag Group.

Here you see an example of adding 3 variations of a “created_by” tag to the “Owner” Tag Group.
Similarly, if you wish to remove a Tag Key from the Tag Group, select it from the column on the right and Unmap the Tag Key. When you have finished mapping or unmapping Tag Keys click on Save to save the new mapping.
Adding a New Tag Group
To add a new Tag Group simply click on “+ TAG GROUP”, give the new group a name and then save.

Once you have saved the new Tag Group, use the Normalize Keys function of the Actions Menu to add Tag Keys to the Tag Group as outlined in Normalizing Keys above.
Allocating by Tag Group
By using Tag Groups in the Allocation rules, you are able to simplify the Allocation rule set to go from something like the image below where we need to account for 3 variations of the Tag Key Product

to using one Tag Group called “Product Tag”

When you have multiple Contexts that reference the same Tag Key to allocate costs, it is much simpler to add any variations in the name used for the Tag Key to one Tag Group, rather than have to add the new variant to each of the different rule sets for the Contexts.
Filtering by Tag Group in the Cost Analytics Dashboard
The Tag Groups are also available in the Cost Analytics Dashboard so you can filter by Tag Group rather than having to select all of the individual Tag Keys that make up that group.

Of course, you still have the option to filter by the individual Tag Keys if needed.
