Anomalies Dashboard
Overview
Anomalies are detected when a categories spending is different from normal. To decide if a day’s spending is outside of normal, we compare each days cost with:
The cost from Yesterday
The average cost of the last 7 days
The average cost of the last 4 same days of the week
The average cost of the last 4 same days of the month
If the day is the last day of the month, compare it with the average cost of the last day of the past 4 months
The minimal difference from all of differences is the number that will be kept to see if the variation in cost is outside of the normal range.
The normal cost range is calculated by using functional approximation and standard deviation and a tolerance threshold is applied. That tolerance threshold can be defined as a specific monetary value (see Anomaly Settings) or an automatic value of 1.14% of the average daily cost for the previous 30 days will be used. If the minimal difference number is greater than the tolerance threshold, the costs for that day are marked as an Anomaly and represented on the graph.
Console Navigation
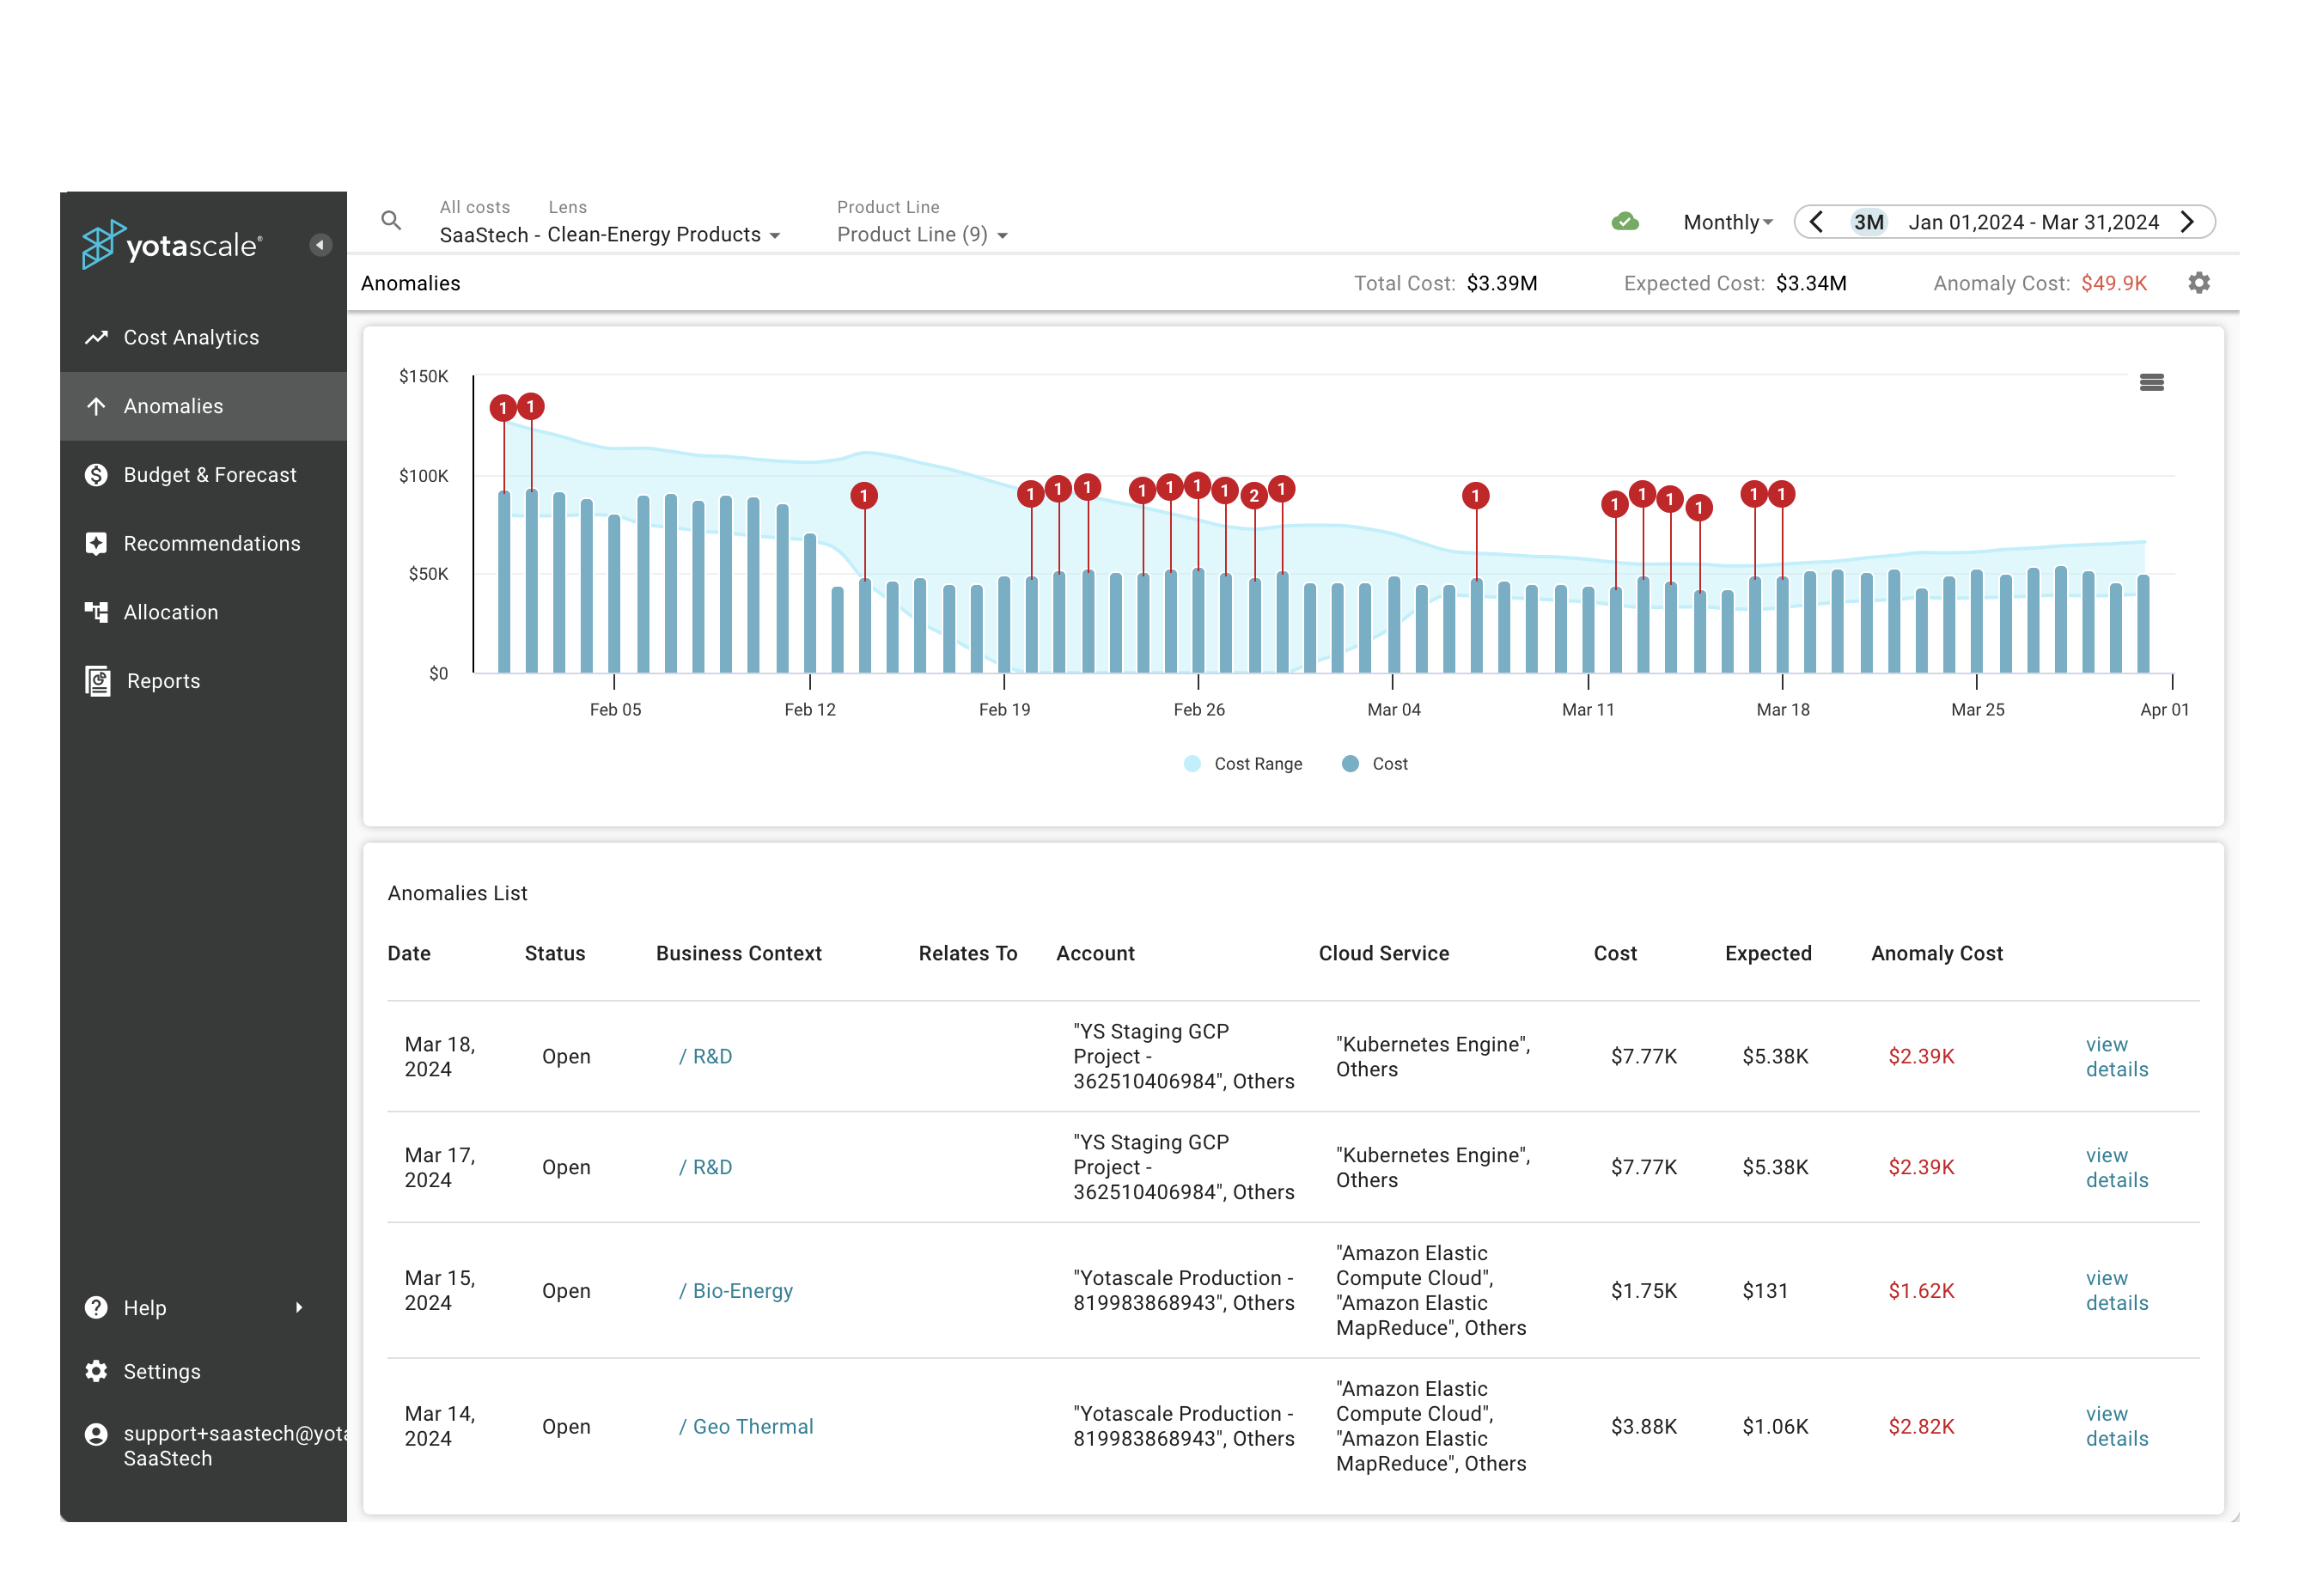
Click on Anomalies in the Navigation Menu on the left side of the screen to get a view of the Anomalies detected within the selected date range for the selected Lens. Along the top of the chart you will see the Total Cost represented on the chart, the Expected Cost , and the Anomaly Cost. There is also a gear icon that will let you adjust the Anomaly Settings.
Anomaly Dashboard
Anomalies will be flagged in red on the chart and displayed as a scrollable list below the chart. Clicking on the Anomaly in the graph will bring up a popup view of the list of Anomalies for that specific date. Each Anomaly in the list in both the popup view and the scrollable list will have an associated Business Context, the Account, Cloud Service, and any Related Contexts noted. In addition, the list will show you what the expected cost for the day was vs. the actual cost and the difference between the two (the Anomaly Cost). You can click on the Business Context to see all Anomalies associated with that Business Context. Click on “view details” for each Anomaly to see the contributing factors for each Anomaly.
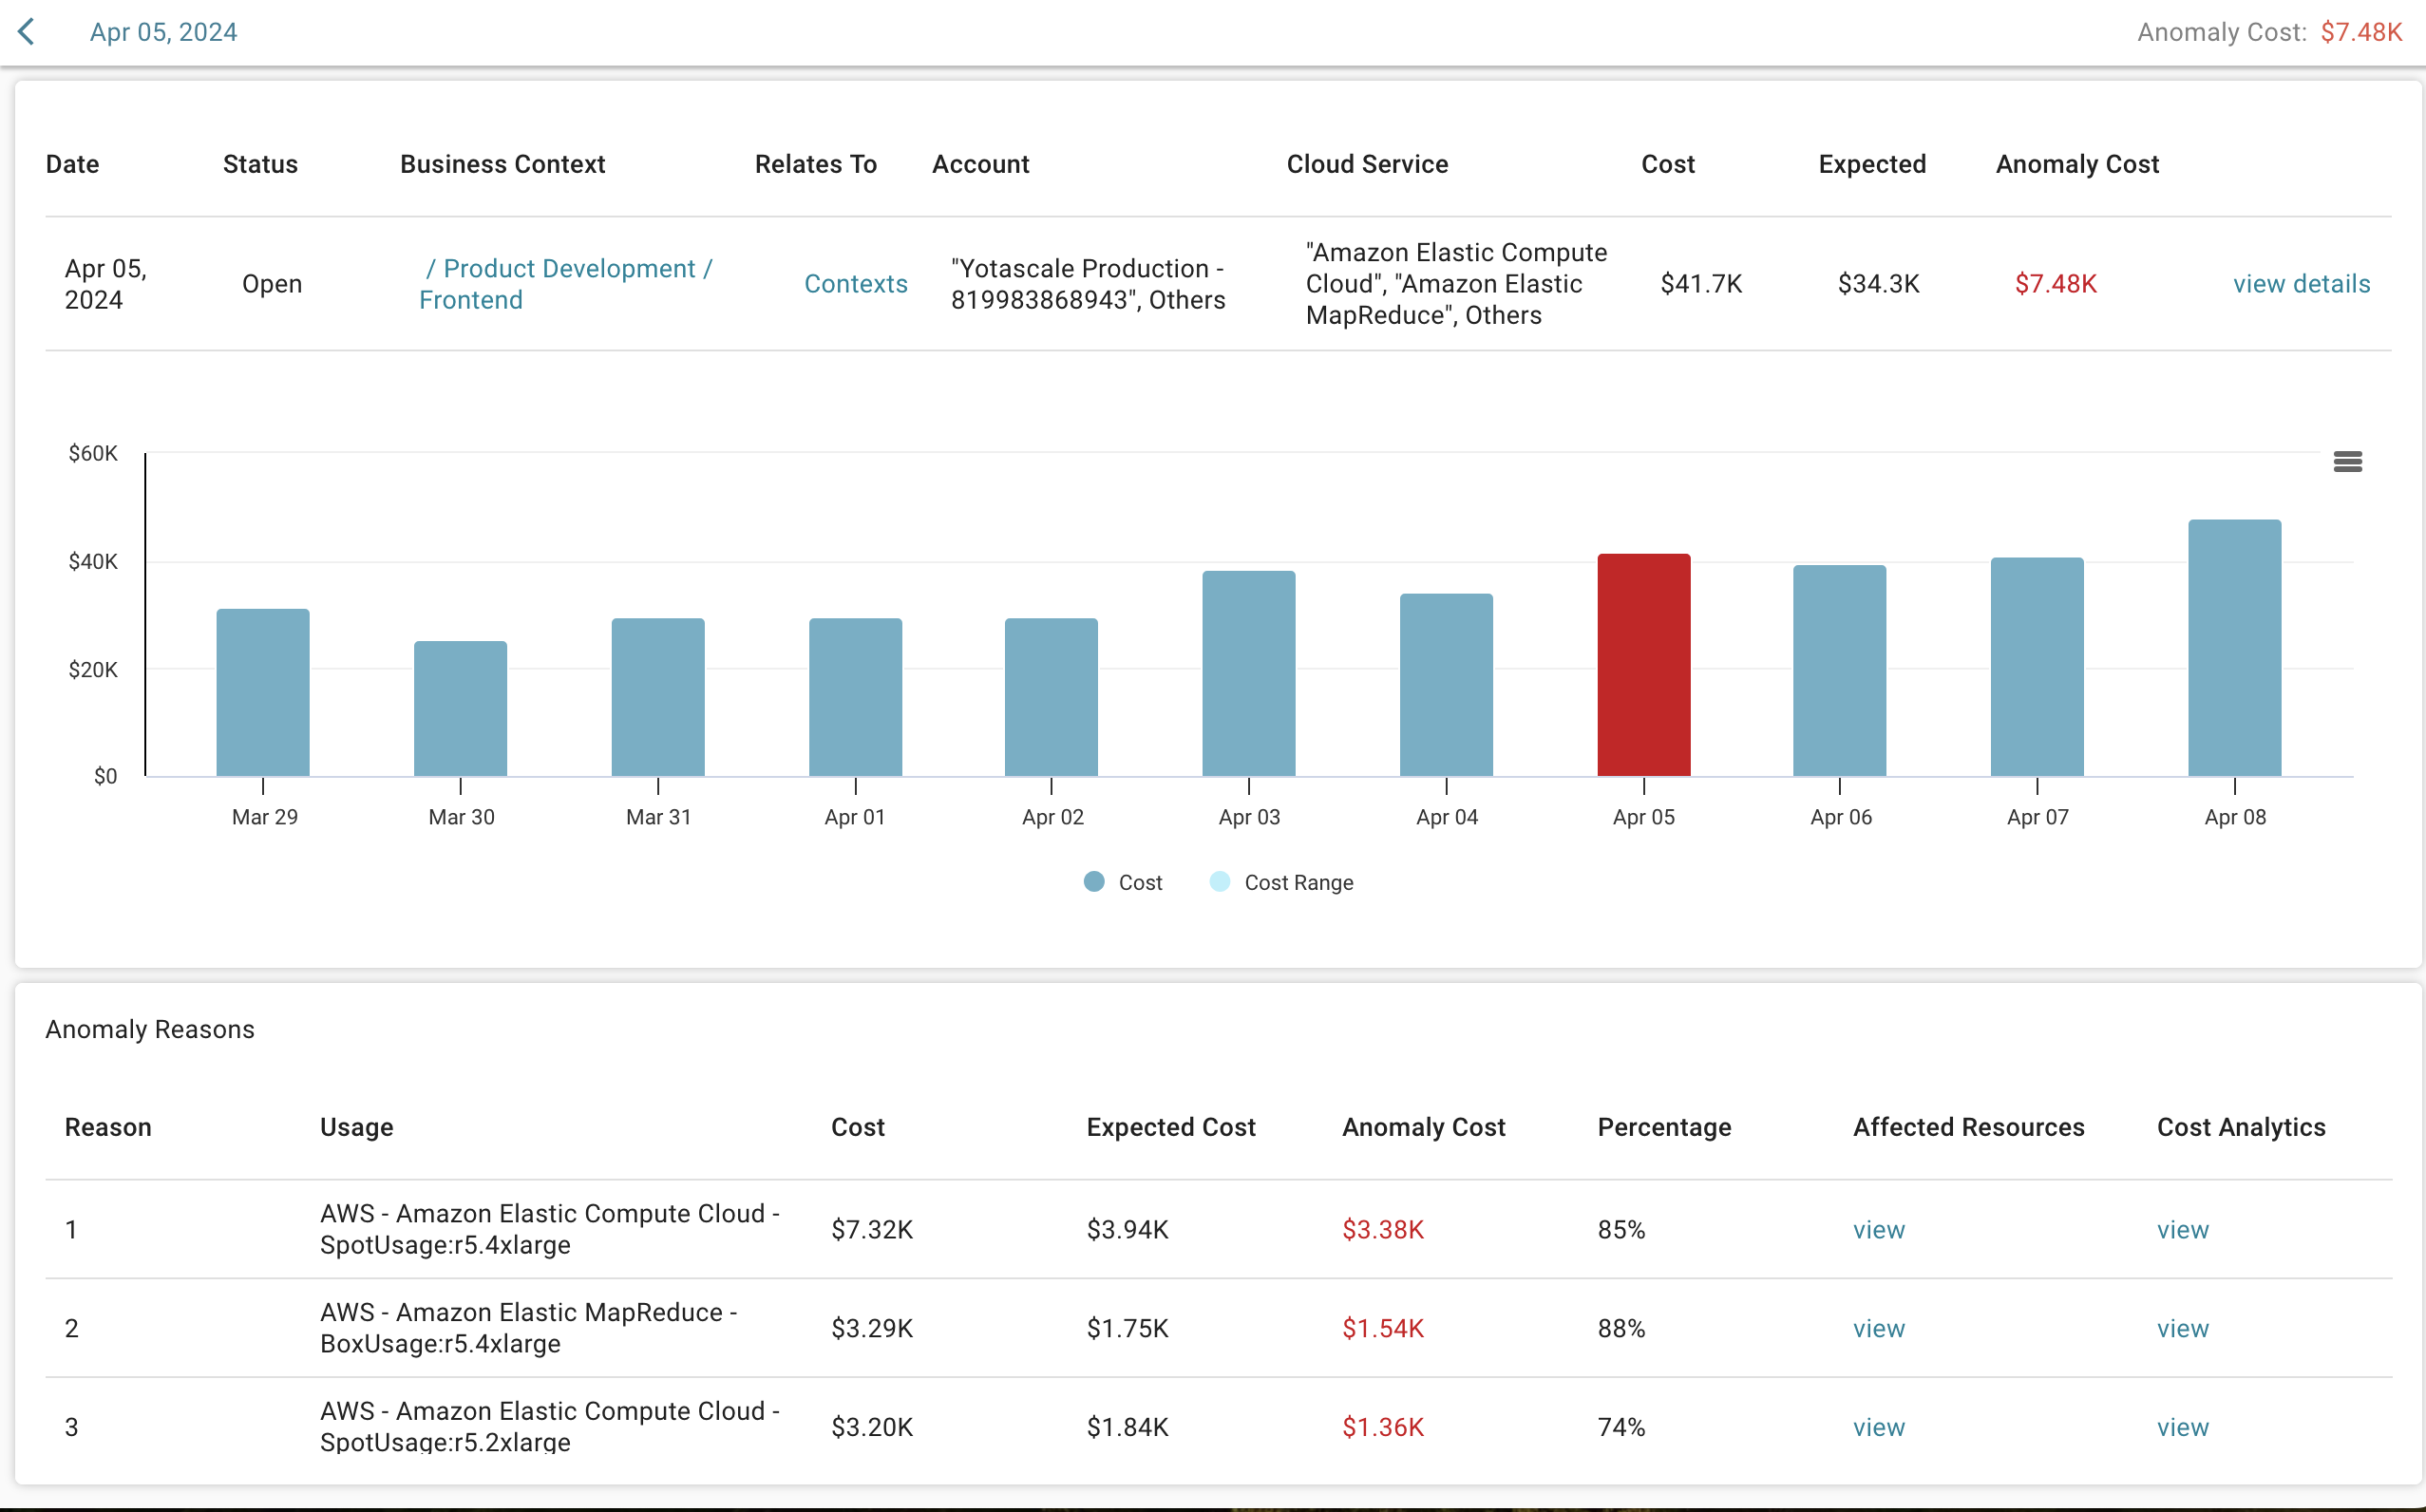
Anomaly Detail View
From here you can view the Affected Resources and see the Cost Analytics dashboard for the time of the Anomaly.
Anomaly Settings
You can manage Global Settings related to Anomalies in the Settings->Anomaly Settings->Global Settings menu.
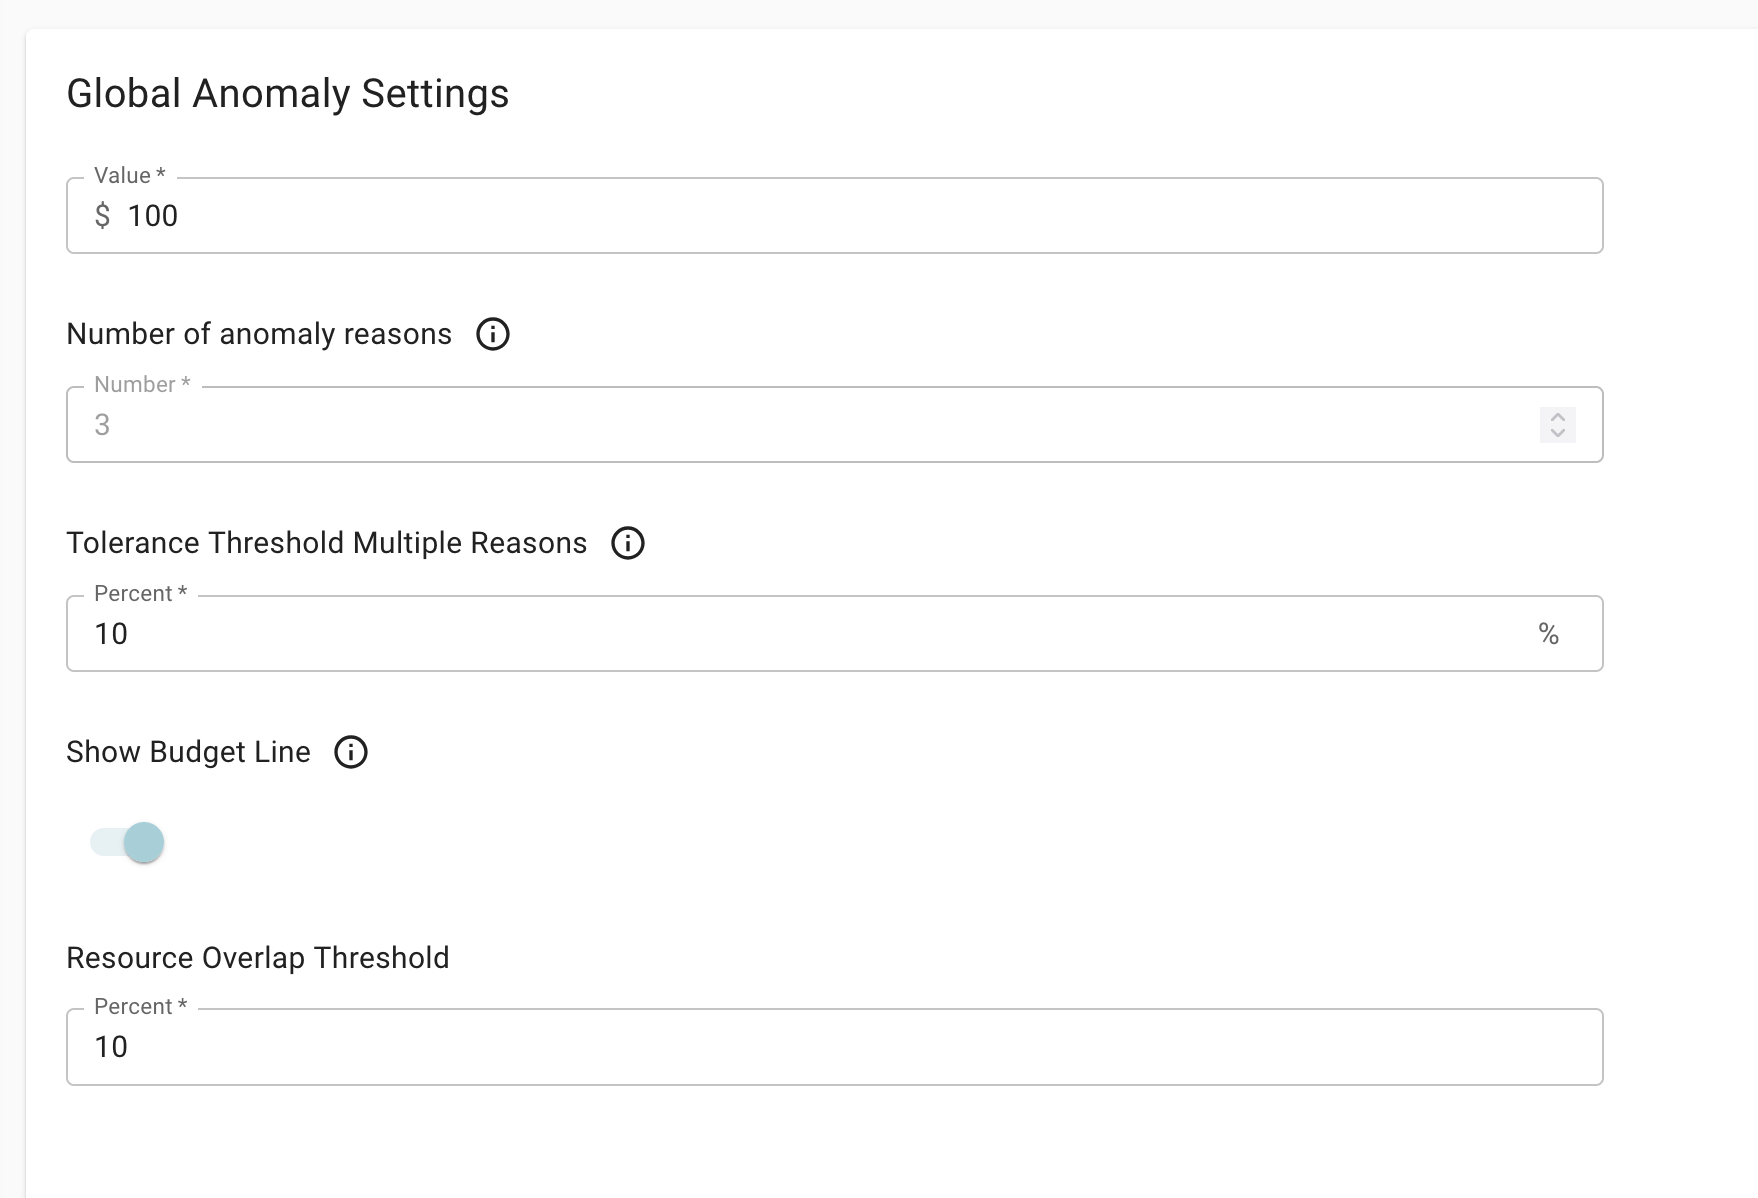
Anomaly Settings Panel
There are currently 3 settings that you can change in this panel.
Value:
You can set a monetary threshold for how far outside the threshold an Anomaly has to be before it is flagged. Some users may wish to know if they’re $100 outside of the normal spend where other users only care if it exceeds $1000. This allows you to set your preferred notification point. If you do not set a value here, the software will set the threshhold at 1.14 % of the average daily cost for the previous 30 days.
Tolerance Threshold Multiple Reasons:
This setting will let you set how much a contributing reason must contribute to the anomaly as a percentage of the top reason before it will be displayed. As an example, let’s say that the R&D team overspent by $1000, the Solar Energy team overspent by $500, and the Wind Power team overspent by $100. That’s an overspend of $1600. If I set my “Tolerance Threshold Multiple Reasons” to 10% all 3 reasons will be displayed. Even though Wind Power only caused 6.25% of the total overspend, their overspend is at least 10% of the top contributor, the R&D team. If I set my Threshold higher than 10% though, Wind Power’s contribution will not be displayed on the Reasons list.
Resource Overlap Threshold:
This setting allows you to determine how much overlap there can be with different resources before an Anomaly is deemed to be a duplicate of an already detected Anomaly. A setting of 100% would mean that all of the resources must match to declare it a duplicate, whereas a setting of 50% would mean that if half of the resources match the resources of an already detected Anomaly, this is deemed a duplicate of that Anomaly and will not be displayed separately.
Currently, the number of Anomaly Reasons is not adjustable. This setting means that Yotascale will show you the top 3 contributors to an Anomaly (anomaly reasons).
Show Budget Line is also not a setting that can currently be changed and means that if there is a defined budget for the viewed Lens or Context, the budget will be shown on the Anomaly graph.
Local Anomaly Settings
You can override any of the global settings at the Lens Level by clicking on the gear icon at the right of the screen just below the date range. A window will pop up that allows you to change any of the settings for the Lens or Context that you are viewing by unchecking the “Use Global Alert Settings” checkbox. Make any changes that you want and click Confirm to update the view. You can also get to the Global Settings menu this way by choosing the “Change Global Alert Settings” link in the checkbox area.
Subscribing to Anomaly Alerts
Yotascale can be set to automatically notify you of Anomalies through email or Slack. To do that you would go to the Settings menu and click on “Subscriptions List” under the Alerts & Subscriptions heading. Click on “+ New Subscription”. Choose Anomalies from the Type drop down menu; choose the Lens or Context you want to monitor and what currency to use. Click Continue and you will go to the Settings configuration. Make sure that you have a check mark by “New Anomalies” and “When detected” to confirm that you want an alert whenever a new Anomaly is detected. Then you choose whether you want to get the alert via email or Slack or both. Click Confirm once again to get to the last configuration page where you will enter in a comma separated list of email addresses and/or the Slack channel and webhook information that Yotascale will use to send the alerts.